
There are three main methods for getting feedback on mobile app behavior: capturing crashes and non-fatal exceptions, capturing user and system events, and generating logs. Each method on its own provides just one piece of the puzzle. It is only when they are all used together in an integrated manner that developers can effectively deal with the exceptions, errors, and issues experienced by the app users.
However, in the production environment, logs are generated on the device that is running the app and are thus not readily visible to the developer. In this blog post, we give hands-on examples of why and how to add the third, crucial pillar to complete the analysis and fixing of app issues in the production environment: logs.
Why Firebase Is Not Enough
The tool of choice for capturing crashes and events is Firebase—with Crashlytics for capturing crashes and a deep integration with Google Analytics for capturing log events. Crashlytics does a great job in real time, issuing alerts if a crash impacts a lot of users or if an issue is suddenly becoming more severe. It also intelligently groups crashes and provides some contextual information to help in troubleshooting. In addition, you can customize the crash reports by adding custom keys, logs, user identifier, and non-fatal exceptions.
Another option in Firebase is leveraging log events, which can be used by developers or product managers to analyze and understand user behavior within the app. Each log event needs to be named, with an upper limit of 500 event names. Parameters, which are also limited, can be added to these events.
But what about user problems that are not crashes or for which you didn’t define an event? For example, a payment transaction that was rejected. First, you may not even know about it. Second, even if you defined a log event, you still won’t have enough information to understand what is causing the problem. This is where logs become critically important. Providing the context for crashes and errors, they let developers see the code that ran before a crash or a non-fatal error and thus shorten the time to understanding and resolving what caused the failure.
Three Real-Life Examples of the Logging Advantage
Unsuccessful Payment Process
Martha is booking a trip on a travel app. She has chosen the destination, the dates, the airline, and the hotel and is now at the critical last step: payment. But for some reason, the payment transaction cannot be completed. No crash has occurred, but this is clearly a serious problem. Perhaps the user will turn to customer support. But it’s more likely she will simply abandon the booking, which means revenue lost. And if she writes a poor review in the app store, there is also damage to reputation.
With the event having been captured by Firebase Analytics, it is now up to the team to figure out what went wrong. In reality, however, the actual problem is hard to identify: Was it insufficient funds? Was it a server connection failure? Was it a problem with the third-party payment processor? From the Firebase interface shown in Figure 1, it is difficult to understand the circumstances that caused the failure. We just see that the payment_charge_error event occurred once.
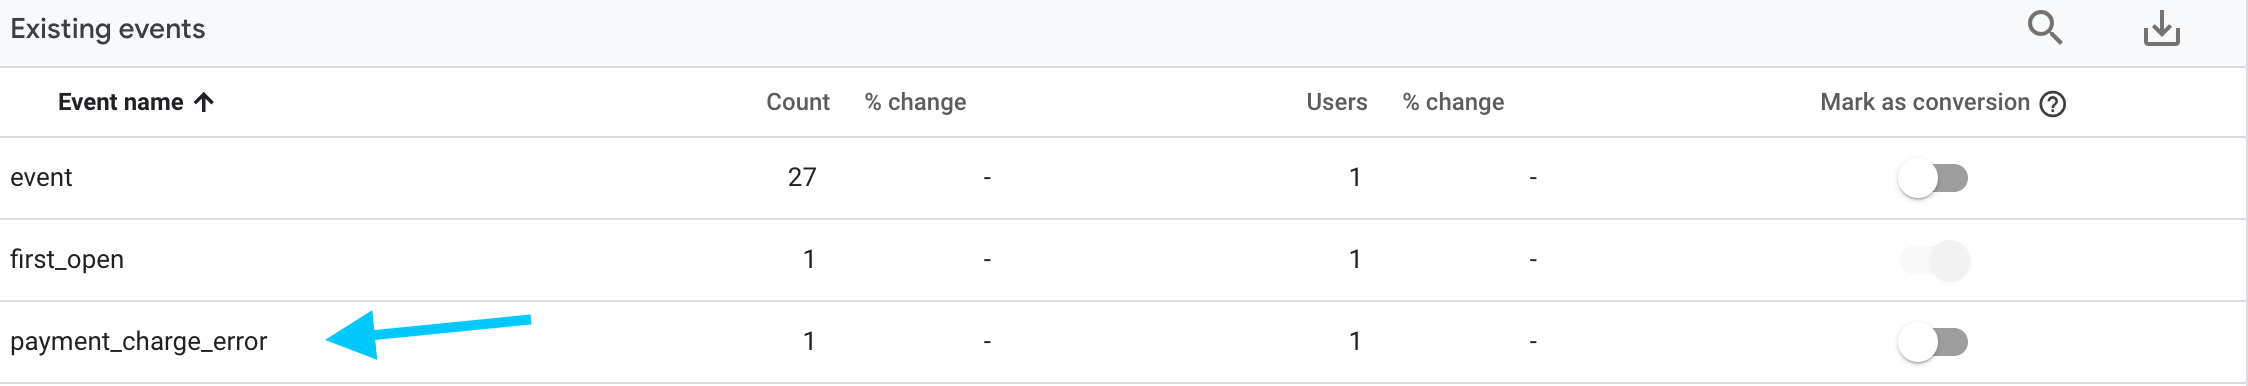
Figure 1: Aborted payment transaction in Firebase Analytics
But what if there was a log to access, as shown in Figure 2? With this kind of information, we can determine the nature of the problem. Next to the payment_charge_error event, we get the additional information that the payment charge could not be completed because of a payment processing failure due to an invalid expiration date. The log helps us understand that there is a bug in the app’s UI, which should check for invalid information entered into the app and, when necessary, alert the user as to why the transaction cannot be completed.

Figure 2: Log entry related to the aborted payment transaction
IoT Device Connection Failure
The Smith family is setting up a security camera at home. The mobile app successfully detects that there is a camera installed, but the app is not displaying the camera’s video stream. The question is why: Is it because the WiFi quality isn’t good enough? Is it because there is an error with the camera? Is it a problem in the app?
In Figure 3, we see the log entries that show that the app is indeed receiving a stream, i.e., the app is properly connected to the camera and the camera is working correctly. We have quickly learned, therefore, that the problem is most likely a bug in the app that prevents it from displaying the stream properly.
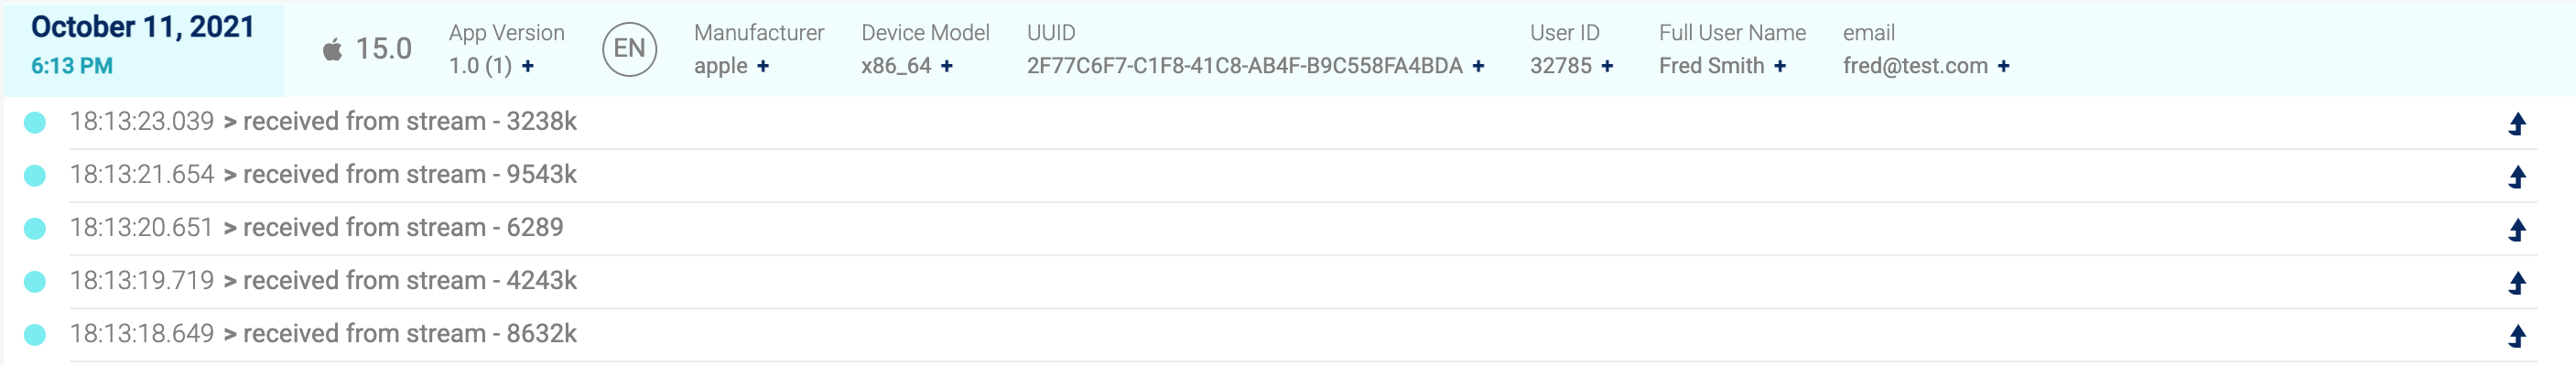
Figure 3: Log entries from the mobile app
It is worth noting that in this use case there won’t be an event captured in Firebase because, from the app’s point of view, everything is working correctly. In reality, however, the user cannot see the video.
Server-Side Failure
Norman White and his colleagues use a corporate social media mobile app to keep information and ideas flowing in the workplace. Norman notices that the feed page doesn’t seem to be refreshing. Although the app is still clearly up and running (i.e., no crash) and there have been no error messages, Norman suspects that something might be wrong.
Norman shoots a query to the app’s customer support contact and, as a first step, one of the mobile app’s developers is tasked with determining if it is a client-side issue. He takes a look at the log entries and sees that the first API call (see the arrow toward the bottom of Figure 4) did indeed return content from the server (starting with “That’s right; starting this month, our games are available to download and play in the beautiful UK!”). But the next API call, which is repeated three times, returns an empty array.
This is good news for the app developer since it shows that the problem is not with the app but with the server and now he can move the ticket over to the server-side developers, along with helpful information that will help them resolve the issue.
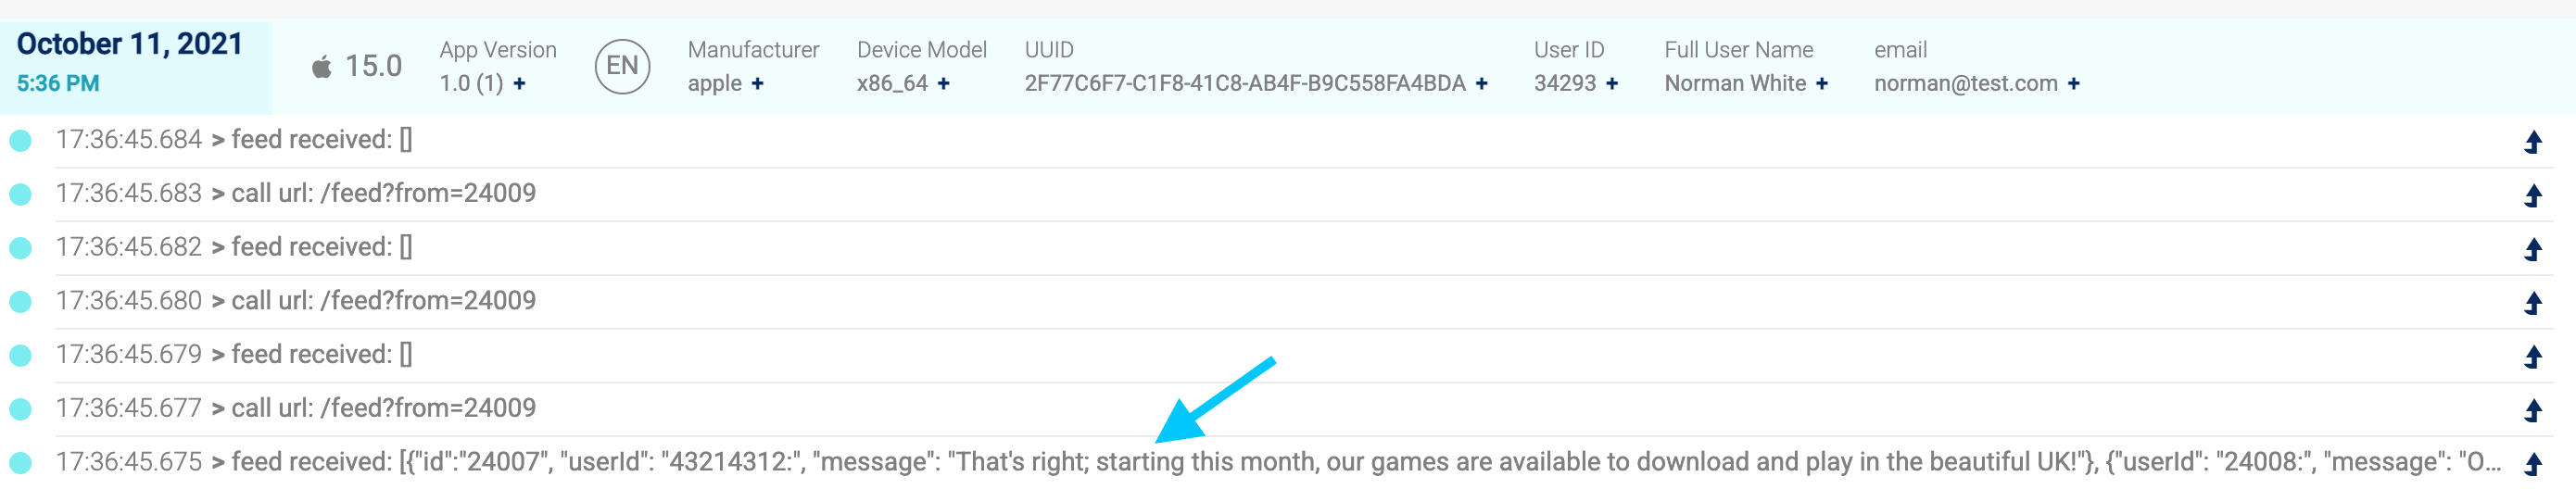
Figure 4: Feed API calls from the app to the server
Summary
In order to effectively monitor and troubleshoot mobile apps, it is not enough to capture crashes and predefined events. First, there are many non-fatal errors that will not cause a crash. Second, it is difficult to anticipate all of the app events that could interfere with the user experience.
The solution is to generate logs that provide a clear trail of the application events that led to the problem. However, in the production environment, it is difficult to access the mobile app logs that are stored on the device. This lack of logs leaves developers in the dark as to what the root cause of a problem may be: Is it an invalid user input? Is it the app code? Is it the server-side code? Is it a network or other communications problem? A logging platform is the solution. It provides the end-to-end visibility that lets you get fixes done quickly and efficiently.
Shipbook + Firebase
Shipbook is a language-agnostic, open-source, cloud-based logging platform for mobile apps. The service collects and stores mobile app logs per user session. The developer can thus see all of the user’s logs in sequence, from the moment she opened the app, plus use a multi-parameter search engine to query the logs.
Other features of Shipbook include:
- Detection and aggregation of recurring error logs.
- Proactive detection of and alert to app performance anomalies.
- Comprehensive overview of application stability over time, across all users, app version, and OSes.
If you are using Firebase today to monitor app exceptions (Crashlytics) and events (Analytics), the good news is that you can easily integrate Shipbook with Firebase (iOS/Android) in order to add that missing link to your monitoring and troubleshooting stack: free-text logs.
With one click in Firebase, you can now view all the logs leading up to the error, analyze the event trail, and get to fixes faster