17 posts tagged with "log"

View All Tags

· 10 min read
Elisha Sterngold

Logs in the Age of AI Agents

Software developers have always relied on logs as a fundamental tool for understanding what happens inside running systems. Logs capture reality: the sequence of events, the state of the system at a given moment, errors that occurred, and the context in which everything happened.

As AI agents increasingly participate in writing, modifying, and maintaining code, it may be tempting to think that logs will become less important — or even obsolete. In practice, the opposite is true. Logs are becoming more critical than ever. The difference is who will primarily consume them, and how they need to be structured.

This post explores why logs remain essential in the age of AI agents, how the nature of logging is likely to change, and what this means for modern development platforms.

AI Makes Mistakes — Just Like Humans

To understand the future role of logs, we need to start with a realistic understanding of how large language models (LLMs) work.

LLMs do not reason about code in the same way compilers, interpreters, or formal verification systems do. They generate output by predicting the most likely next token based on vast amounts of training data. This makes them extremely powerful pattern generators — but not infallible problem solvers.

As a result:

  • LLMs make mistakes, sometimes obvious and sometimes subtle.
  • They can produce code that looks correct but fails under real-world conditions.
  • They are prone to hallucinations — confidently generating incorrect logic, APIs that don’t exist, or assumptions that are not grounded in reality.
  • They often lack awareness of runtime behavior, concurrency issues, environmental differences, or system-specific edge cases.

Let’s look at a few concrete examples.

Example 1: Android Logging Gone Wrong

Imagine an AI agent generating Android code to log network responses:

Log.d("Network", "Response: " + response.body().string())

At first glance, this looks fine. But in practice, calling response.body().string() consumes the response stream. If the same response is later needed for parsing JSON, the app will crash or behave unpredictably. Both human developers and AI models can overlook this subtle side effect during implementation or testing.

Proper logging would look like this:

val bodyString = response.peekBody(Long.MAX_VALUE).string()
Log.d("Network", "Response: $bodyString")

However, even with this fixed version, there’s still an occasional issue where it can run into memory problems, especially when processing extremely large responses or values that approach the system’s maximum capacity.

This exactly shows the complexity of code. Without logs showing the crash or missing data, the AI agent would have no feedback that its generated code caused a runtime issue.

Example 2: iOS threading Issues

Consider an AI model generating Swift code for updating the UI after a background network call:

URLSession.shared.dataTask(with: url) { data, response, error in
if let data = data {
self.statusLabel.text = "Loaded \(data.count) bytes"
}
}.resume()

This code compiles and may even work sometimes, but it violates UIKit’s rule that UI updates must occur on the main thread. The result could be random crashes or UI glitches.

A correct version would wrap the UI update in a DispatchQueue.main.async block:

DispatchQueue.main.async {
self.statusLabel.text = "Loaded \(data.count) bytes"
}

Logs capturing the crash or warning from the runtime would be the only reliable signal for the AI agent to detect and correct this mistake.

Example 3: Hallucinated APIs

LLMs sometimes invent REST APIs that don’t exist — something that might only become apparent once the product is running in production. For example, an AI might generate code that calls a fictional endpoint:

val response = Http.post("https://api.myapp.com/v2/user/trackEvent", event.toJson())
if (response.isSuccessful) {
Log.i("Analytics", "Event sent successfully")
}

If that /v2/user/trackEvent endpoint was never implemented, the code will compile and even deploy, but the system will start logging 404 errors or timeouts once it’s live. Those logs are the only signal — for both humans and AI agents — that the generated API was imaginary and needs correction.

These limitations are not bugs; they are intrinsic to how current models operate. Even as models improve, it is unrealistic to expect near-future AI-generated code to be consistently perfect in production environments.

This is precisely where logs remain indispensable.

Logs as the Source of Truth

When something goes wrong in production, developers don’t rely on intentions, comments, or assumptions — they rely on evidence. Logs provide that evidence.

The same applies to AI agents.

Regardless of whether code is written by a human or generated by an AI, runtime behavior is the ultimate arbiter of correctness. Logs record what actually happened, not what was expected to happen.

They answer questions such as:

  • What sequence of events led to this state?
  • What inputs did the system receive?
  • Which branch of logic was executed?
  • What errors occurred, and in what context?
  • How did external dependencies respond?

Without logs, both humans and AI agents are left guessing.

Why AI Agents Need Logs

As AI agents increasingly participate in development workflows — generating code, refactoring systems, fixing bugs, and even deploying changes — logs become a critical feedback mechanism.

Logs Close the Feedback Loop

AI agents operate on predictions. Logs provide feedback from reality.

By analyzing logs, an AI agent can:

  • Validate whether generated code behaved as intended
  • Detect mismatches between expected and actual outcomes
  • Identify patterns that indicate bugs or regressions
  • Learn from failures in real production conditions

Without logs, AI agents have no reliable way to distinguish correct behavior from silent failure.

Logs Enable Root Cause Analysis

When failures occur, understanding why they happened requires context. Logs provide structured breadcrumbs that allow both humans and AI to trace causality across components, services, and time.

As AI systems take on more responsibility, automated root cause analysis will increasingly depend on rich, well-structured logs.

How Code Will Be Built in the Future

The rise of AI agents is not just changing how code is written — it is changing how software systems evolve over time.

We are moving toward a world where:

  • AI agents generate and modify large portions of code
  • Humans supervise, review, and guide rather than author every line
  • Systems are continuously adjusted based on runtime feedback
  • Debugging and remediation are increasingly automated

In such an environment, logs are no longer just a debugging tool. They become a primary interface between running systems and intelligent agents.

Think of logs as a bidirectional communication channel: they allow AI agents to observe system behavior in real-time, understand what's happening across distributed components, and make informed decisions about modifications and fixes. Just as APIs define how different services communicate, logs define how AI agents perceive and interact with running software. An AI agent monitoring logs can detect anomalies, correlate events across services, identify patterns that indicate potential issues, and even trigger automated responses — all without direct human intervention. This transforms logs from passive historical records into an active, queryable representation of system state that enables autonomous decision-making.

Logs May No Longer Be Written for Humans

One of the most significant shifts ahead is that logs may no longer need to be primarily human-readable.

Historically, logs were formatted for developers reading them line by line: timestamps, severity levels, free-form text messages, and stack traces.

But if the primary consumer of logs is an AI agent, the requirements shift fundamentally. Instead of human-readable prose, logs must become structured data streams that machines can parse, analyze, and reason about. Rather than a developer scanning through text messages, an AI agent needs programmatic access to event data with clear schemas, explicit context, and traceable relationships between events. The format matters less than the ability for algorithms to extract meaning, detect patterns, and make decisions based on what actually happened — not what a human thought was worth writing down.

Human readability becomes secondary. Humans may still access logs — but often through AI-generated summaries, explanations, and insights rather than raw log lines.

Logs as Active Participants in Autonomous Systems

As observability evolves, logs will increasingly move from passive storage to active participation in system behavior. Today, logs are primarily archives — repositories of what happened, consulted after the fact. Tomorrow, they will be real-time inputs that directly influence system actions.

We can already see early signs of this transformation:

  • Logs triggering alerts and automated workflows — when an error pattern appears, systems can automatically scale resources, restart services, or notify teams
  • Logs feeding anomaly detection systems — machine learning models analyze log streams to identify deviations from normal behavior before they escalate
  • Logs being correlated with metrics and traces — combining different signals to build comprehensive views of system health
  • Logs used to gate deployments or rollbacks — automated systems evaluate log patterns to decide whether a new release should proceed or be reverted

In AI-driven systems, this trend accelerates dramatically. Logs become the substrate on which autonomous decision-making is built. Instead of simply reacting to alerts, AI agents can proactively analyze log patterns, predict issues before they manifest, and autonomously implement fixes. An AI agent might notice subtle degradation patterns in logs, correlate them with recent code changes, generate a targeted fix, test it against historical log data, and deploy it — all without human intervention. In this model, logs aren't just records of the past; they're the sensory input that enables systems to observe, reason, and act autonomously.

Shipbook and the AI Age of Logging

At Shipbook, we believe logs are not going away — they are evolving.

Shipbook was built to give developers deep visibility into real-world application behavior, with features like:

  • Powerful search and filtering
  • Session-based log grouping
  • Proactive classification in loglytics

But we take this even further with our Shipbook MCP Server. By implementing the Model Context Protocol, we allow AI agents to directly connect to your Shipbook account. This means your AI assistant can now search, filter, and analyze real-time production logs to help you debug issues faster and more accurately.

But we are also looking ahead.

We are actively developing capabilities that prepare logs for the AI age: logs that are easier for machines to interpret, analyze, and reason about — while still remaining useful for human developers.

As AI agents become first-class participants in software development, logs won't just be a debugging tool — they'll be the trusted interface that enables intelligent systems to understand, learn from, and improve the code they generate. That's the future we're building at Shipbook: logs that power both human insight and AI autonomy.


Ready to prepare your logging infrastructure for the AI age? Shipbook gives you the power to remotely gather, search, and analyze your user logs and exceptions in the cloud, on a per-user & session basis. Start building logs that work for both your team today and the AI agents of tomorrow.

· 8 min read
Kevin Skrei

Lessons Learned From Logging

Intro

Writing software can be extremely complex. This complexity can sometimes make finding and resolving issues incredibly challenging. At Arccos Golf, we often run into these kinds of problems. One of the unique things about golf is that a round of golf is like a snowflake or a fingerprint, no two are alike. A golfer could play the same course every day without ever replicating a round identically.

Thus, trying to write software rules about the golf domain inevitably leads to bugs. And since no two rounds of golf are the same, trying to reproduce a user issue they encounter on the golf course is nearly impossible. So, what have we done to attempt to track down some of these issues? You guessed it, logging.

Logging has proven to be an indispensable tool in my workflow, especially when developing new features. This article aims to guide you through key questions that shape a successful logging strategy along with some considerations around performance. Concluding with practical insights, it features a few case studies from Arccos Golf, demonstrating how logging has been instrumental in resolving real-world bugs.

The Arccos app showing several shot detection modes available (Phone & Link)

Figure 1: The Arccos app showing several shot detection modes available (Phone & Link)

Should you log?

When trying to track down a bug or build a new feature, and you're considering logging, the first question to ask yourself is, “Is logging the right choice?”. There are many things to consider when deciding whether to add logging to a particular feature. Some of those considerations are:

  1. Do I have any other tools at my disposal that could be useful if this feature fails? This could be an analytics platform that shows screenviews, and perhaps logs metadata in another way besides traditional logging.
  2. Will adding logging harm the user in any way? This includes privacy, security, and performance.
  3. How will I actually get or view these logs if something goes wrong?

What to log?

Logging should be strategic, focusing on areas that yield the most significant insights.

  1. Identifying Critical Workflows: Determine which parts of your app are crucial for both users and your business. For instance, in a finance app, logging transaction processes is key.
  2. Focusing on Error-Prone Areas: Analyze past incidents and pinpoint sections of your app that are more susceptible to errors. For example, areas with complex database interactions or integrations with 3rd party SDKs might require more intensive logging.

What About Performance?

One of the primary challenges with logging is its impact on performance, a concern that becomes more pronounced when dealing with extensive string creation. To mitigate this, consider the following tips:

  1. Method Calls in Logs: Be wary of incorporating method calls within your log statements. These methods can be opaque, masking the complexity or time-consuming operations they perform internally.
  2. Log Sparingly: Practice judicious logging. Over-logging, particularly in loops, can severely degrade performance. Log only what is essential for debugging or monitoring.
  3. Asynchronous Logging: If your logging involves file operations or third-party libraries, always ensure that these tasks are executed on a background thread, thus preserving the main thread's responsiveness and application performance.

Implementing these strategies will help you strike a balance between obtaining valuable insights from logs and maintaining optimal application performance. I have found that you develop an intuition about what to log the more you practice and learn about the intricacies of your system.

How Do I Access The Logs?

The most straightforward and easiest method to access your applications logs is utilizing a third-party software tool like Shipbook, which offers the convenience of remote, real-time access to your logs.

Finally, I wanted to showcase a few stories illustrating how logging has helped us solve real-world production issues, along with some lessons learned about logging performance.

The 15-Minute Mystery

Our Android mobile app faced an intriguing issue. We noticed conflicting user feedback reports: one showed normal satisfaction, while another indicated a significant drop. The key difference? The latter report included golf rounds shorter than 15 minutes.

Upon investigating these brief rounds, we found that their feedback was much lower than usual. But why? There were no clear patterns related to device type or OS.

The trail of breadcrumbs started when we examined user comments on their rounds, many of which mentioned, "No shots were detected." Diving into the logs of these short rounds, a pattern quickly emerged. We repeatedly saw this line in the logs:

    [2023-12-01 14:20:09.322] DEBUG: Shot detected with ID: XXX but no user location was found at given shot time

This means that we detected a user took a golf shot but we didn’t know where they were on earth to place the shot at a particular location. This was unusual because we had seen log lines like this in our location provider which requests the phones GPS location:

    [2023-12-01 14:20:08.983] VERBOSE: Received GPS location from system with valid coordinates

So, we were clearly receiving location updates at regular intervals but we couldn’t associate them when a shot was taken by the user. After some further analysis, we discovered this line:

    [2023-12-01 14:20:09.321] VERBOSE: Attempting to locate location for timestamp XXX but requested source: “link” history is empty. Current counts: [“phone”:60, “link”:0]

We have a layer above our location providers that handles serving locations depending on which method the user selected for shot detection mode (either their Phone or their external hardware device “Link”). It was attempting to find a location for “Link” even though all of these rounds should have been in phone shot detection mode. Finally, we located this log line:

    [2023-12-01 14:14:33.455] DEBUG: Starting new round with ID: XXX and shot detection mode: Link … { metadata: { “linkConnected”: false, linkFirmwareVersion: null }... }

Once we analyzed this log line it became immediately obvious - The app was starting the round with the incorrect shot detection mode. Some rounds were started with shot detection mode of Link even if the Phone was selected in the UI (Figure 2).

The Arccos app showing a round of golf being played and tracked

Figure 2: The Arccos app showing a round of golf being played and tracked

We eventually identified the issue and it was due to some changes in our upgrade pathing code if users had certain firmware and prior generations of our Link product. Thankfully, this build was early in its incremental rollout and we were able to patch it quickly.

This experience highlighted the crucial role of widespread effective logging in mobile app development. It allowed us to quickly identify and fix an issue, reinforcing the importance of comprehensive testing and attentive log analysis.

When Too Much Detail Backfires

Dealing with hardware is especially difficult given you can rarely easily get information off of the hardware device. We often rely on verbose logging during the development phase to diagnose communication issues between hardware and software. This approach seemed foolproof as we added a new feature to our app, implementing detailed logging to capture every byte of data exchanged with the hardware of our new Link Pro product. In the controlled environment of our office, everything functioned seamlessly in our iOS app.

While on the course testing our app faced an unforeseen adversary: it began to get killed by the operating system. The culprit? Excessive CPU usage. Our iOS engineer, armed with profiling tools, discovered a significant CPU spike during data sync with the external device. Our initial assumption was straightforward – perhaps we were syncing too much data too quickly.

To test this theory, we modified the app to sync data less aggressively. This change did reduce app terminations, but it was a compromise, not a solution. We wanted to offer our users real-time experience without interruptions. Digging deeper into the profiling data, we uncovered the true source of our problem. It wasn't the Bluetooth communication overloading the CPU; it was our own verbose logging.

The moment we disabled this extensive logging, the CPU usage dropped dramatically, bringing it back to acceptable levels. This incident was a stark reminder of how even well-intentioned features, like detailed logging, can have unintended consequences on app performance. We decided to use a remote feature flag paired with a developer setting to be able to toggle detailed verbose logging of the complete data transfer only when necessary.

Through this experience, we learned a valuable lesson: the importance of balancing the need for detailed information with the impact on app performance. In the world of mobile app development, sometimes less is more. This insight not only helped us optimize our Link Pro product but also shaped our approach to future feature development, ensuring that we maintain the delicate balance between functionality and efficiency.

Afterword

In conclusion, our experiences at Arccos Golf have demonstrated the invaluable role of logging in software development. Through it, we’ve successfully navigated the complexities of writing golf software, turning unpredictable challenges into opportunities for improvement. Tools like Shipbook have been instrumental in this journey, offering the ease and flexibility for effective log management. I hope I’ve illustrated that logging is more than just a troubleshooting tool; it's a crucial aspect of understanding and enhancing application performance and user experience.

· 9 min read
Nikita Lazarev-Zubov

iOS Log

Logging is the process of collecting data about events occurring in a system. It’s an indispensable tool for identifying, investigating, and debugging incidents. Every software development platform has to offer a means of logging, and iOS is no exception.

Being a UNIX-like system, iOS supported the syslog standard from as long as iOS has been around (since 2007). In addition, from 2005 Apple System Log (ASL) has been supported by all Apple operating systems. However, ASL isn’t perfect: It has multiple APIs performing similar functions to one another; it stores logs in plain text, and it requires going deep into the file system to read them. It also doesn’t perform very well, because string processing happens mostly in real time. While ASL is still available, Apple deprecated it a few years ago in favor of an improved system.

Apple’s Unified Logging

In 2016, Apple presented its replacement for ASL, the OSLog framework, also known as unified logging. And “unified” is right: It has a simple and clean API for creating entries, and an efficient way of reading logs across all Apple platforms. It logs both kernel and user events, and lets you read them all in a single place.

Beyond its impressive efficiency and visual presentation, unified logging offers performance benefits. It stores data in a binary format, thus saving a lot of space. The notorious observer effect is mitigated by deferring all string processing work until log entries are actually displayed.

Let’s dive in and put unified logging to work.

Unified Logging in Depth

Writing and Reading Logs

The easiest way to create an entry using OSLog is to initialize a Logger instance and call its log method:

    import OSLog

let logger = Logger()
logger.log("Hello Shipbook!")

After running this small Swift program, the message "Hello Shipbook!" will appear in the Xcode debug output:

Xcode debug output

Figure 1: Xcode debug output

Since unified logging stores its data in binary format, reading that data requires special tools. This is why Apple introduced the brand new Console application alongside the framework. This is how the log message appears in Console:

The Console application for reading unified logging messages

Figure 2: The Console application for reading unified logging messages

As you can see, unified logging takes care of all relevant metadata for you: Human-readable timestamps, the corresponding process name, etc.

Another often underestimated way of reading logs is by means of the OSLog framework itself. The process is straightforward: You only need to have a specific instance of the OSLogStore class and a particular point in time that you’re interested in. For example, the code snippet below will print all log entries since the app launch:

    do {
let store = try OSLogStore(scope: .currentProcessIdentifier)
let position = store.position(timeIntervalSinceLatestBoot: 0)

let entries = try store.getEntries(at: position)
// Do something with retrieved log entries.
} catch {
// Handle possible disk reading errors.
}

This might be useful in testing, or for sending logs to your servers.

Log Levels

For grouping and filtering purposes, logs are usually separated into levels. The levels signify the severity of each entry. Unified logging supports five levels, with 1 being the least problematic and 5 being the most severe. Here’s the full list of supported levels and Apple’s recommendations for using them:

  1. The debug level is typically used for information that is useful while debugging. Log entries of this level are not stored to disk, and are displayed in Console only if enabled.
  2. The info level is used for non-essential information that might come in handy for debugging problems. By default, the log messages at this level are not persisted.
  3. The default level (also called notice level) is for logging information essential for troubleshooting potential errors. Starting from this level, messages are always persisted on disk.
  4. The error level is for logging process-level errors in your code.
  5. The fault level is intended for messages about unrecoverable errors, faults, and major bugs in your code.

Beyond their use in classifying error severity, log levels have an important impact on log processing: The higher the level, the more information the system gathers, and the higher the overhead. Debug messages produce negligible overhead, compared to the most critical (and supposedly rare) errors and faults.

Here’s how different levels can be used in code:

    logger.log(level: .debug, "I am a debug message")
logger.log(level: .info, "I am info")
logger.log(level: .default, "I am a notice")
logger.log(level: .error, "I am an error")
logger.log(level: .fault, "I am a fault, you're doomed")

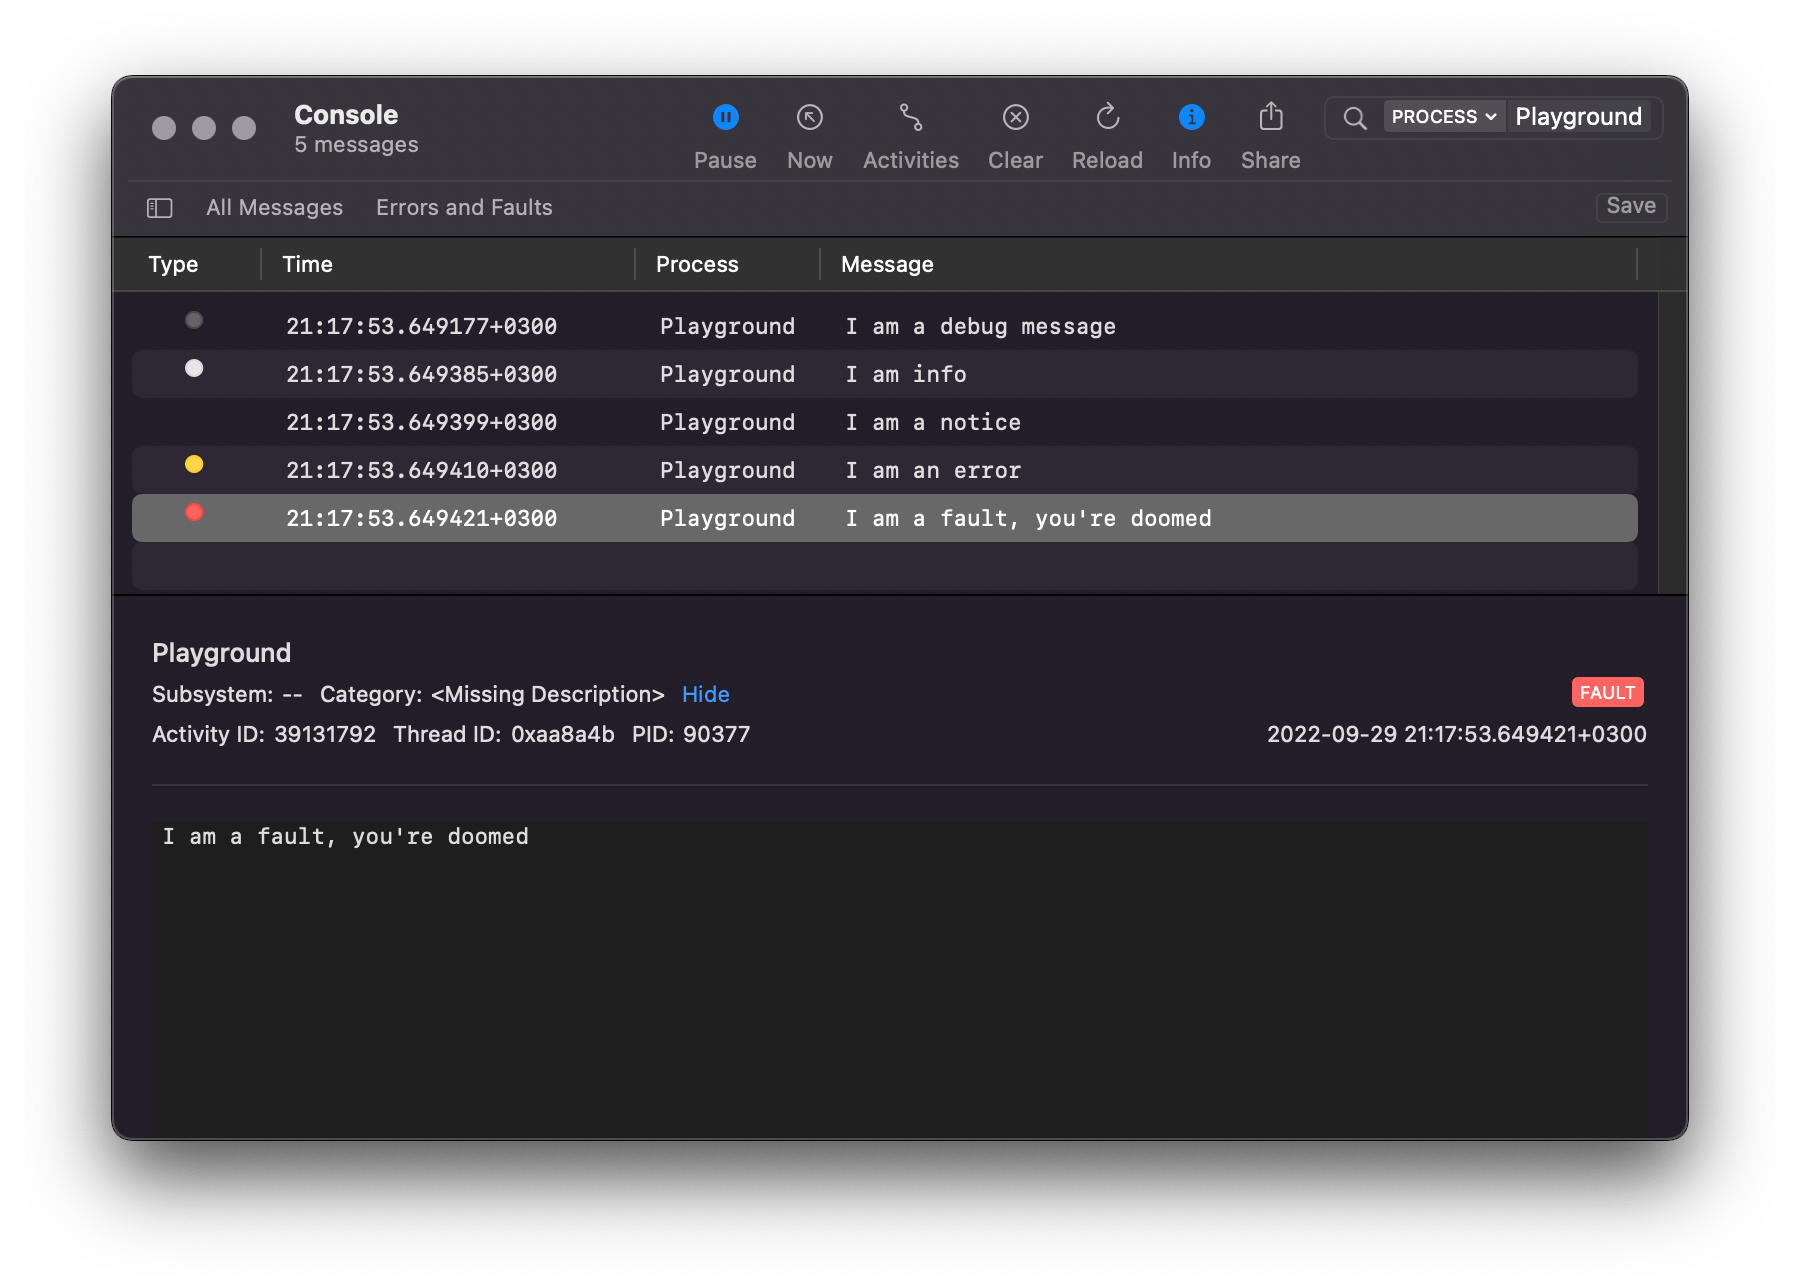
And this is how those entries look in Console:

Logs of different levels in Console

Figure 3: Logs of different levels in Console

The debug and info messages are only visible here because the corresponding option is enabled. Otherwise, messages would be shown exclusively in the IDE’s debug output.

Subsystems and Categories

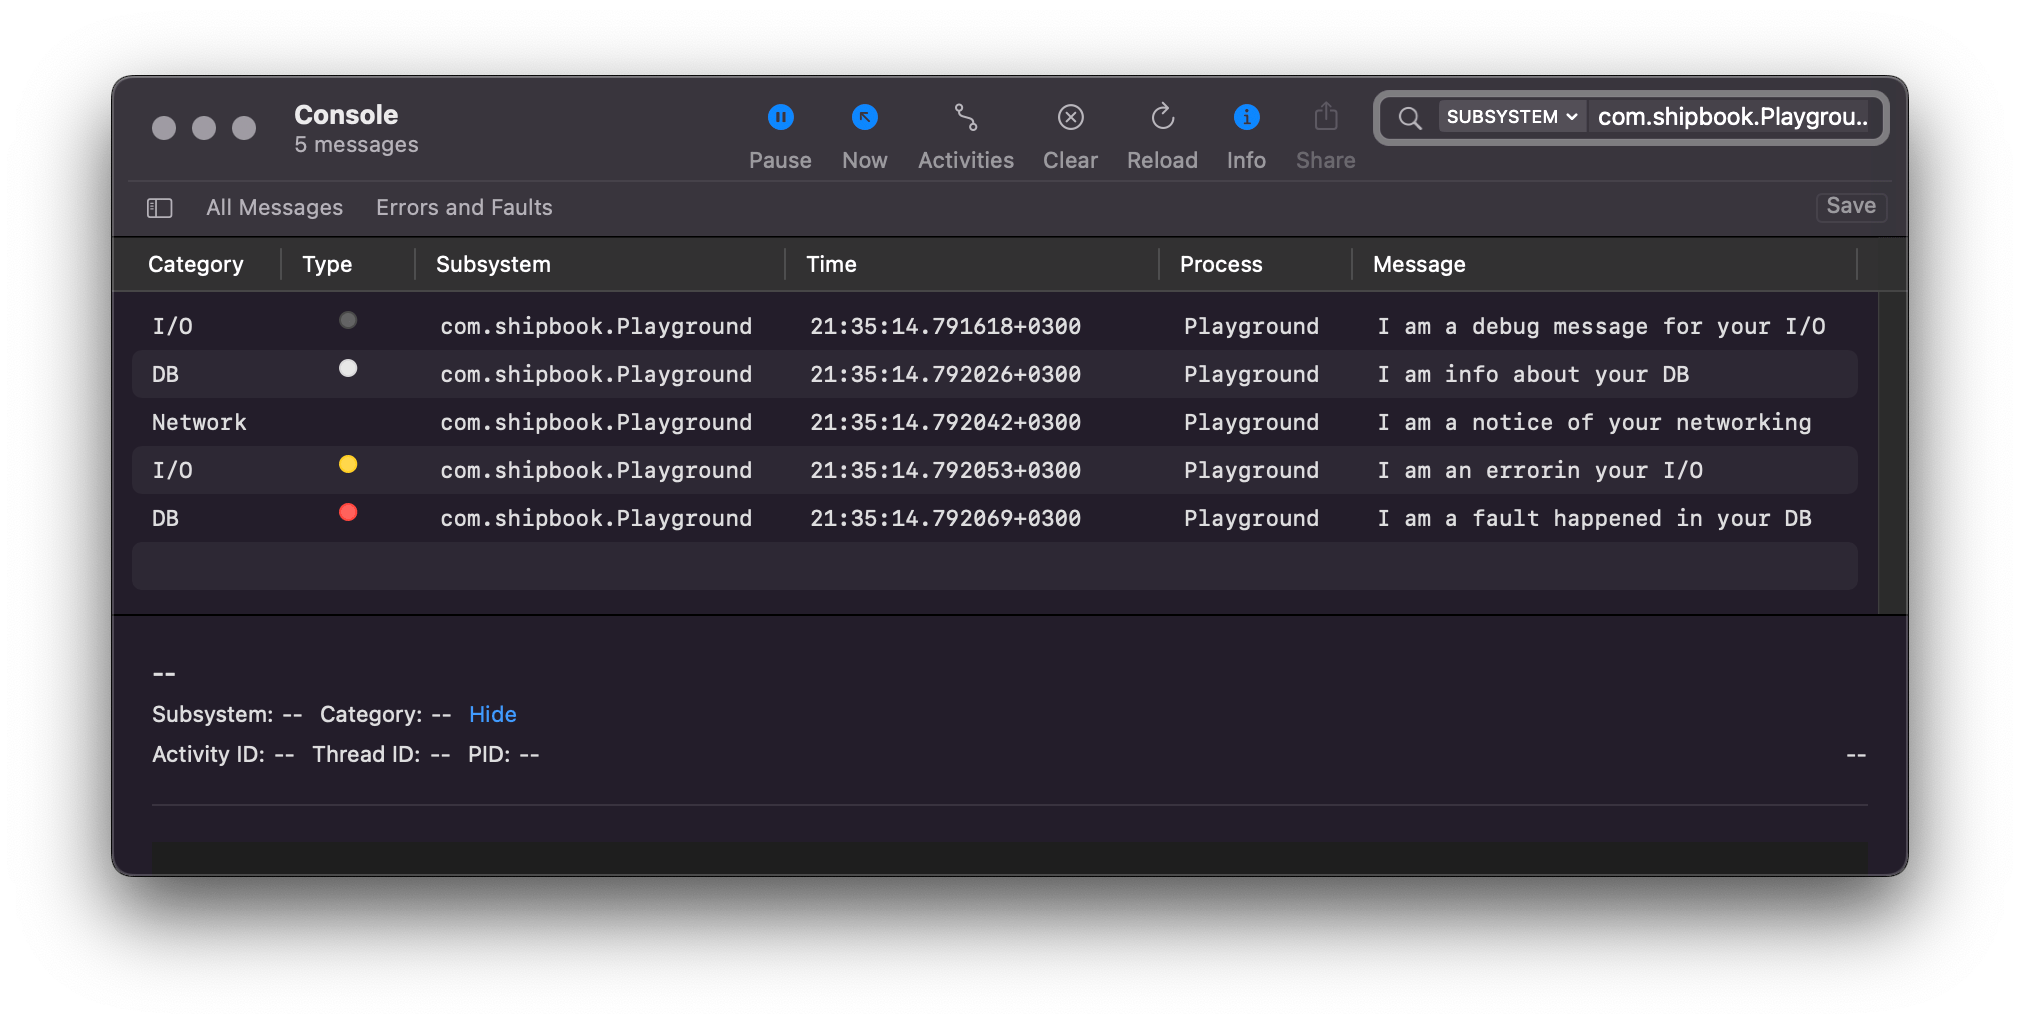
Logs generated by all applications are stored and processed together, along with kernel logs. This means that it’s crucial to have a way to organize log messages. Conveniently, Logger can be initialized using strings denoting the corresponding subsystem and the category of the message.

The most common way (and the method recommended by Apple) to denote the subsystem is to use the identifier of your app or its extension in reverse domain notation. The other parameter is used to categorize emitted log messages, for instance, “Network” or “I/O”. Here’s an example of a logger for categorized messages in Console:

    let logger = Logger(subsystem: "com.shipbook.Playground",
category: "I/O")

Log categorization in Console

Figure 4: Log categorization in Console

Formatting Entries

Static strings are not the only type of data we want to use in logs. We often want to log some dynamic data together with the string, which can be achieved with string interpolation:

    logger.log(
level: .debug,
"User \(userID) has reached the limit of \(availableSpace)"
)

Strictly speaking, the string literal passed as a parameter to the log method is not a String, it’s an OSLogMessage object. As I mentioned before, the logging system postpones processing the string literal until the corresponding log entry is accessed by a reading tool. The unified logging system saves all data in binary format for further use (or until it’s removed, once the storage limit is exceeded).

All common data types that can be used in an interpolated String can also be used inside an OSLogMessage: other strings, integers, arrays, etc.

Redacting Private Data

By default, almost all dynamic data—i.e., variables used inside a log message—is considered private and is hidden from the output (unless you’re running the code in Simulator or with the debugger attached). In Figure 5, below, the string value is substituted by “<private>”, but the integer is printed publicly.

Redacted private entry

Figure 5: Redacted private entry

Only scalar primitives are printed unredacted. If you need to log a dynamic value—like string or dictionary—without redacting, you can mark the interpolated variable as public:

    logger.log(
level: .debug,
"User \(userID, privacy: .public) has reached the limit of \(availableSpace)"
)

Apart from public, there are also private and sensitive levels of privacy, which currently work identically to the default level. Apple recommends specifying them anyway, presumably to ensure that your code is future-proof.

In many cases, you will want to keep data private while identifying it in logs massif. This option could come in handy for filtering out all messages concerning the same user ID, for example, in which case the variable can be hidden under a mask:

    logger.log(
level: .debug,
"User \(userID, privacy: .private(mask: .hash)) has reached the limit of \(availableSpace)"
)

The value in the output will be meaningless, but identifiable:

Private data hidden under a mask

Figure 6: Private data hidden under a mask

Performance Measuring

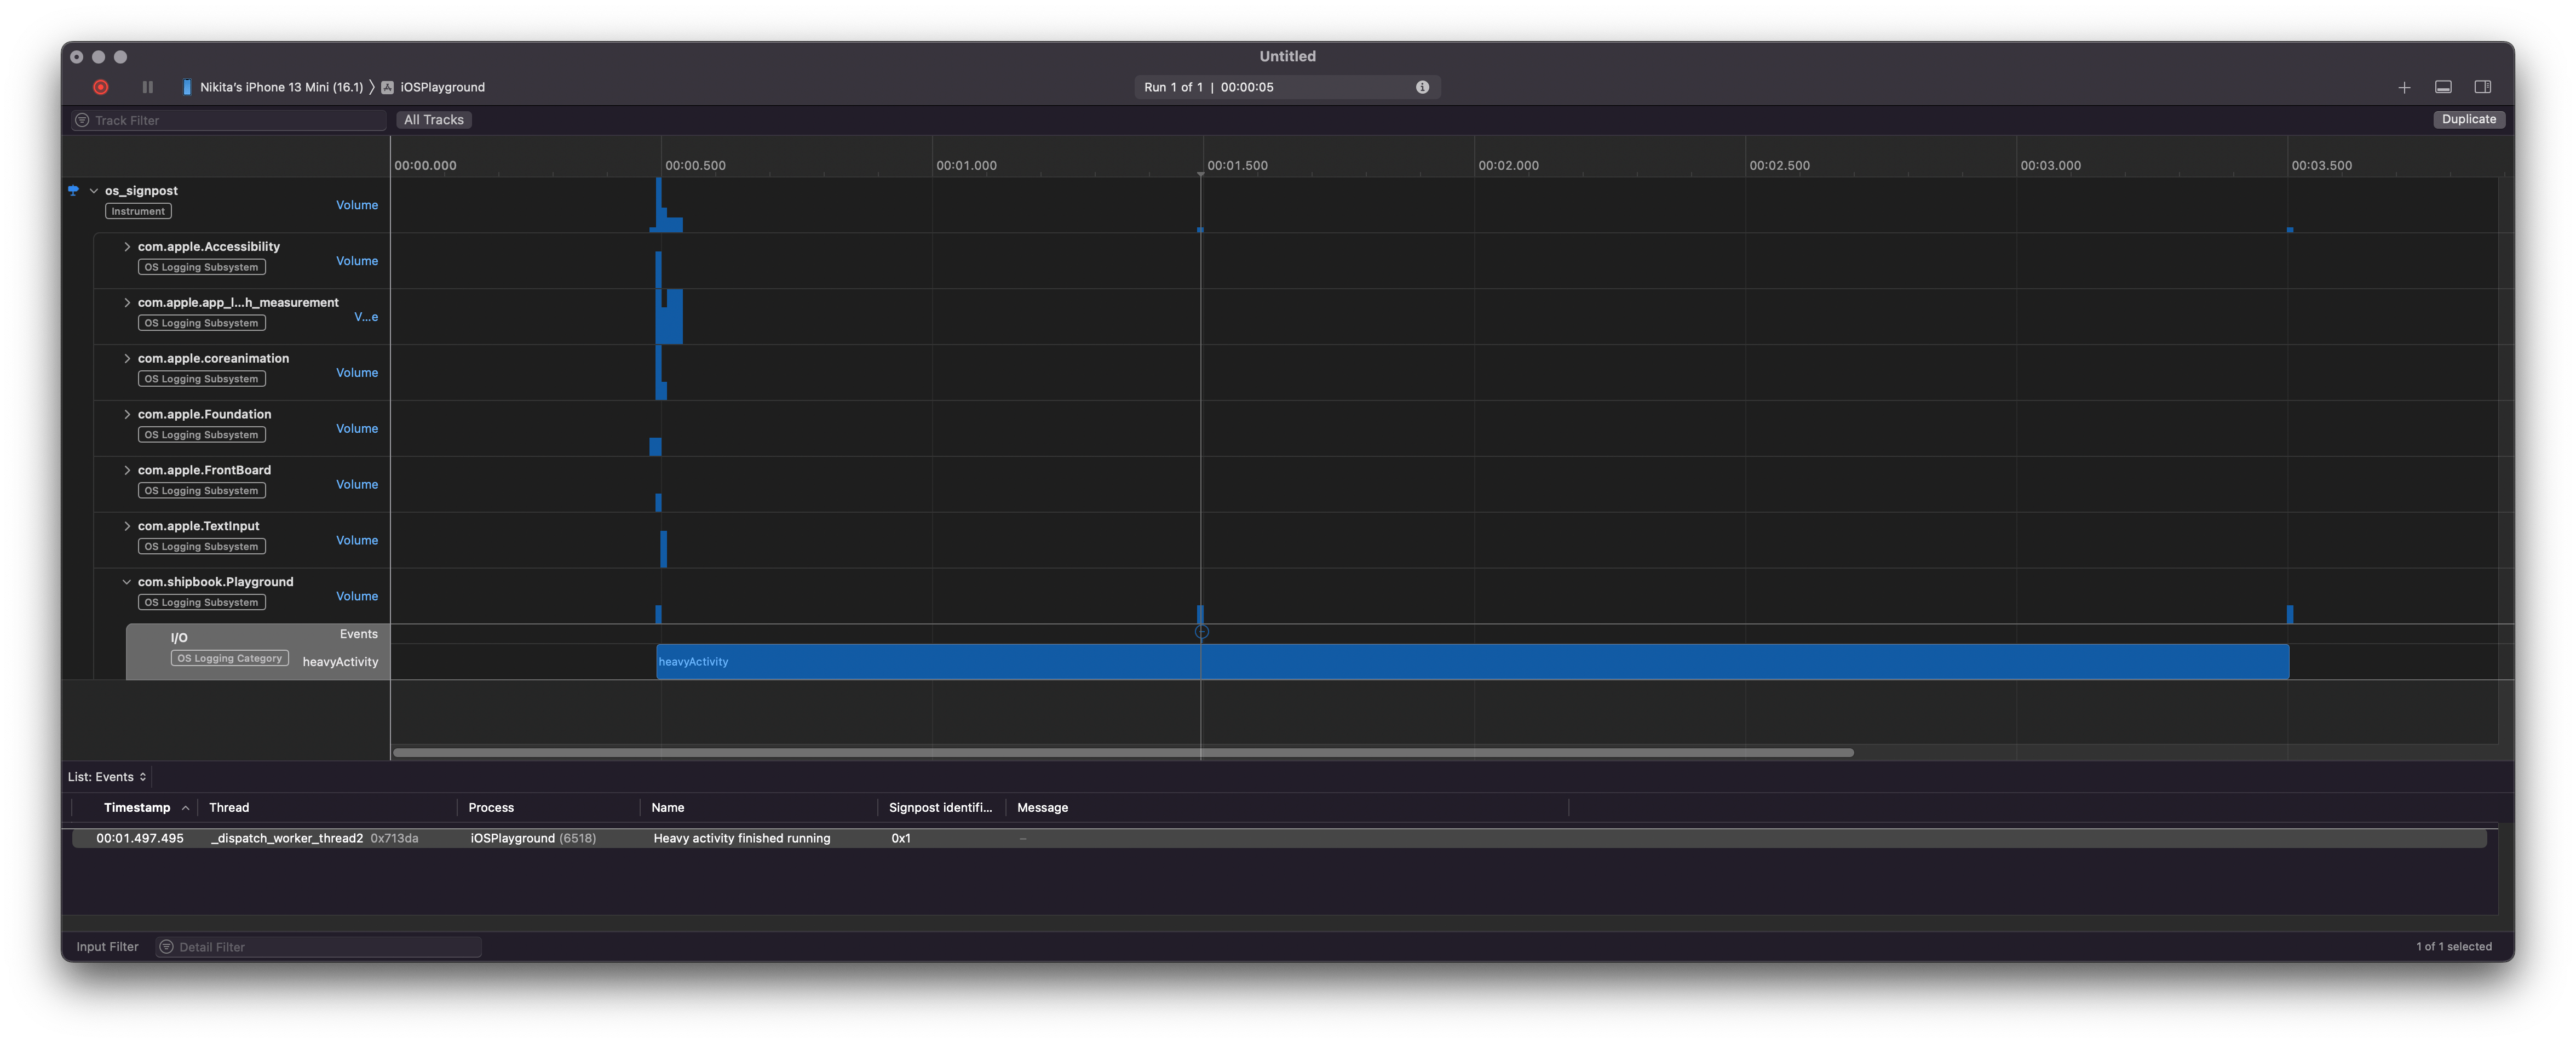
A special use case of unified logging is performance measurement, a function that was introduced two years after the system was first released. The principle is simple: You create an instance of OSSignposter and call its methods at the beginning and end of the piece of code that you want to measure. Optionally, in the middle of the measured code you can add events, which will be visible on the timeline when analyzing measured data. Here’s how it looks in assembly:

    let signposter = OSSignposter(logger: logger)
let signpostID = signposter.makeSignpostID()

// Start measuring.
let state = signposter.beginInterval("heavyActivity",
id: signpostID)

// The piece of code of interest.
runHeavyActivity()
signposter.emitEvent("Heavy activity finished running",
id: signpostID)
finalizeHeavyActivity()

// Stop measuring.
signposter.endInterval("heavyActivity", state)

You can analyze this data using the os_signpost tool in Instruments:

Performance measurement using OSSignposter

Figure 7: Performance measurement using OSSignposter

Conclusion

Apple’s unified logging is both powerful and simple to use. As its name suggests, the system can be used with all Apple platforms: iOS, iPadOS, macOS, and watchOS, using either Swift or Objective-C. Unified logging is also efficient thanks to its deferred log processing and compressed binary format storage. It mitigates the observer effect and reduces disk usage.

Gathering logs using OSLog is a great option when you’re debugging or have access to the physical device. However, when it comes to accumulating logs remotely, you need a different solution. Shipbook can take care of your needs by allowing you to gather logs remotely. Shipbook offers a simple API similar to OSLog’s, and a user-friendly interface that helps you to observe and analyze collected data.

Importantly, Shipbook integrates with Apple’s Unified Logging System, enhancing your workflow by letting you utilize the familiar tools provided by Apple when your device is connected. This integration ensures a seamless transition between remote logging and local diagnostics, making Shipbook a versatile tool for developers who require both remote data collection and the capabilities of Apple’s native logging system.

· 13 min read
Yossi Elkrief
Elisha Sterngold

Yossi Elkrief

Interview with Mobile Lead at Nike, Author, Google Developers Group Beer Sheva Cofounder, Yossi Elkrief

Thank you for being with us today Yossi, would you like to begin with sharing a little bit about your position at Nike, and what you do?

I joined Nike for a bit more than two years now. I am head of mobile development in the Digital Studio of innovation. It is a bit different from regular app development but we still work closely with all the teams in WHQ, Nike headquarters in the US as well as Europe, China, and Japan. We really work across the globe, and we do some pretty cool things in the realm of innovation. We develop new technologies and try to find ways to harness new technologies or algorithms to help Nike provide the best possible service to our consumers.

I have experience in mobile for the past 13, almost 14 years now. I’ve been involved in Android development since their very first Beta release, even a bit before that. I also worked on iOS throughout the years, and I’ve been involved in a couple of pretty large consumer based companies and startups.

At Nike we have a few apps, such as: Nike Training Club (NTC), Nike Running Club (NRC), and the Nike app made for consumers, where you can purchase Nike’s products.

We work with all of those teams and other teams within Nike, on various apps as well as in-house apps that are specific creations of our studio, where we work on creating new innovative features for Nike.

One major project that is currently working on completing roll out is Nike Fit, recently launched in China and Japan. Nike Fit, is aimed at helping people shop Nike shoes online and hopefully for other apparels in the near future.

How is it working for Nike, as a clothing company, with a background of working mainly for tech companies?

Nike is a company with so much more technology than people realize. We are not just a shoe company or a fashion company.

Our mission is to bring inspiration and innovation to every athlete1 in the world.

We use a tremendous amount of technology to transform a piece of fabric into a piece in the collection of the Nike brand. Nike may be more faceforward than companies that I’ve worked for in the past, but there is a vast array of technologies that we work with in Nike, or work on building upon, to make Nike the choice brand for our customers, now and in the future.

One of the highest priorities at Nike is the athlete consumers. Because Nike is a brand that is specifically designed and geared toward athletes. We therefore try to keep all of Nike’s athletes at the forefront in terms of their importance to the company. Consumer facing, most of Nike’s products are not the apps. All of my previous experiences in app companies or technical companies that provide a service are pretty different from what I focus on now at Nike. So everything we do at Nike, all the services we provide, are to help serve athletes in their day to day activities, whether this be in sports for professional athletes, or for people with hobbies like running, football, or cycling and so on.

Everything I focus on has to do with providing athletes with better service while choosing their shoes, pants, or all the equipment they need, and that Nike provides so they can best utilize their skills.

Can you tell us a bit about what went into writing your book “Android 6 Essentials”? Do you feel that writing the book improved your own skills as a developer?

I write quite a lot. I don’t get to write as many technical manuals as I’d like, but I do write quite a few documentations, technical documents, and blog posts. Writing the book was a different process, but I really wanted to engage a technical audience, as this audience is very different from that of a poem, or story, which is less for use and more for enjoyment.

Writing the book made me a better person in general because I was working full time in the capacity of my position at the company that I was with at the time, and then on top of all of my regular responsibilities, in order to be able to keep to schedule and hit all of the milestones, and points that I wanted to cover in my book. I had to be very organised and devoted to the project. I had to juggle work, and family, and all of my other responsibilities as well, so I divided my time to make sure I could meet all of my goals. The process was really quite fun because in the end I had something that I built and created from scratch.

I would recommend it, because it gives you an added value that no one else will have, and in the end you have a final product that you can show someone, and say that it was your creation. I think the whole process makes you a better developer, and it helps you understand technology better, because you need to understand technology at a level and to a degree of depth in order to then explain it in writing to someone else.

You also took part in co-founding Google Developers Group Beer Sheva, which is also about sharing knowledge and bettering yourselves as developers, can you tell us a little about that process?

The main aim of Google Developers Group is sharing knowledge. When we share knowledge we can learn from everyone. Even if I built each of the pieces of a machine myself, when I share it with someone else, they can always bring to light something that I was unaware of; some new and interesting way of using it. Sharing with people helps more than just the basic value of assistance. Finding a group of peers that share the same desire or passion for technology, knowledge, and information, this is a key concept in growth, for everyone in general.

On that note, we are seeing an interesting trend in development: even though mobile apps are becoming increasingly more complex, the industry has succeeded in reducing the occurrence of crashes. Is that your experience as well and if so, what are, in your eyes, the main reasons for this shift?

It’s really a two part answer.

Firstly, both Google and Apple are providing a lot more information, and are focusing a lot more on user experience in terms of crashes, app not responding, bad reviews etc. Users are more likely to write a good review if you provide more information, or create a better service with more value for them. Consumers in general are more interested in using the same app, the same experience, if they love it. So they will happily provide you with more information so that you can solve its issues, and keep using your app rather than trying something new. We call them Power Users or Advanced Users. With their help, we can keep the app updated and solve issues faster.

The second part of the answer is that all of the tools, ID integrations, shared knowledge, documentation, has been vastly improved. People understand now that they need to provide a service that runs smoothly with as little interference as possible for the user and they do their part to make sure that these issues remain as low as possible in the apps. We want a crash rate lower than 0.1%. So we work 90% of our time to build an infrastructure that will remain robust and maintain top quality, with a negligible amount of crashes, exceptions, and app issues, in general, that will harm and affect the user experience.

Do you believe that all bugs should always be fixed? If not, do you have ways of defining which ones do not need to be fixed?

As a perfectionist, yes, we want to solve all of the app issues. But in terms of real life, we work with a simple process. We look at the impact of the bug. How many users are being impacted? What is the extent to the impact? What does the user have to do in order to use the service? Is it just a simple work around or is it preventing the user from using an important part of the app?

Do you close insignificant issues, or are they kept open in a back office somewhere?

No, so we are very careful and organized about all of the issues that we have in the system. We document every issue with as much information as possible. Sometimes you can fix an issue with dependency and provide a new version for some dependencies and then because of all the interactions of the code versions you have some issues being solved even though you didn’t do anything. So for example, this doesn’t happen much, but sometimes we have issues in the backlog that can remain unsolved for more than a month.

What is your view on QA teams? Some companies have come out saying that they don’t use QA teams and instead move that responsibility to the developer team. Do you believe that there should be a QA Team?

I believe that companies should have a Quality Assurance team, which is sometimes also called QE, Quality Engineering. I think as a developer, working on various platforms, when you implement a new feature or service, give or take on the architecture of the technology, the actual issue can be quite difficult to find. This requires a different point of view than the developer. When you develop or write the code, you have a different point of view in mind then users often have when it comes to using the app. 90% of the time users will actually often behave differently than developers anticipated when writing the code. So when we design the feature, sometimes we need to understand a bit better how users will interact. We have a product team that we involve and engage on an hourly basis. The same goes for QA. We use QA in our Innovation Studio as well, but the same goes for our apps. We are constantly engaging QA to see how to both resolve issues and understand better how the user will interact with the app.

What is your position on Android Unit testing: How are the benefits compared to the efforts?

With testing in general, some will say it's not necessary at all and will just rely on QA. I don’t side with either. I think it is a mix. You don't need to unit test every line of code. I think that is excessive. Understanding the architecture is more important than unit testing. It's more important to understand how and why the pieces of the puzzle interact- to understand why to choose one flow over another, than to just unit test every function. Sometimes pieces of the puzzle are better understood with unit testing, but it is not necessary to unit test everything. That said, the majority of our code does undergo UI and UX testing.

What do you think about the fact that with Kotlin, you don’t state the exception in the function, this is unlike Java or Swift, which both require it. Which approach do you prefer?

I think for each platform there are different methods of working. Both approaches are fine with me. I think the Kotlin approach for Android, or for Kotlin in general, gives the developer more responsibility as to what can go wrong. You need to better understand the code and the reasons behind what can go wrong with exceptions when working with Kotlin. You can solve it using annotations and documentation, but in general people need to understand that if something can go wrong it will. They need to understand then how to solve it within the runtime code that they are writing, or building. If you are using an API, then API documentation will provide you with a bit more knowledge as to what is happening under the surface, and in terms of architecture, yes you need to know that when using an API function call or whichever function you are using within your own classes, you still need to interact with them properly, so it drives you to write better code handling for all exceptions.

Do you feel the fragmentation of devices or versions in Android is a real difficulty?

Yes, we see different behaviors across devices and different versions, and making sure that the app runs smoothly across all platforms can be a bit rough. But even so, it is a lot better than what we had in the past. I hope that as we progress in time, more and more devices will be upgraded to use an API level that is safer to use, and will mitigate fragmentation. Right now, some of the features that we are building, for example API 24 and above, have major progress in comparison to API 21 and above.

As a final question, which feature would you dream that Android or Kotlin would have?

I never thought of that, because, a week ago I would say camera issues on Android. But a month ago I would say, running computer vision in AI on Android on different devices. Camera issues are due to different hardwares. Google is doing a relatively good job in trying to enforce a certain level of compliance and testing on all devices. You have quite a few tests the device has to pass both in hardware and in API. But we still see many devices attempt to bypass, or give false results to the tests.

I would say giving us support for actual devices as far back as five to seven years, instead of three, and giving an all around better camera experience over all devices.

Thank you very much to Yossi Elkrief for your time and expertise!


Shipbook gives you the power to remotely gather, search and analyze your user logs and exceptions in the cloud, on a per-user & session basis.

Footnotes

  1. If you have a body, you are an athlete.

· 13 min read
Dotan Horovits
Elisha Sterngold

Dotan Horovits

Interview with Technology Evangelist | Podcaster | Speaker | Blogger at Logz.io

Dotan started his career as a developer, moved to become a System Architect and Director of Product Management. This gives a broad understanding of various aspects of app development, which is extremely relevant for this blog where we focus on app quality in a broad sense. Today, Dotan is a Technology Evangelist, Podcaster, Speaker and Blogger

On LinkedIn you present yourself as Principal Developer Advocate and Technology Evangelist. Can you describe what you mean by these titles?

Essentially what this means is that I help the developer community use the products at my company Logz.io, as well as with the broader open source projects in the domain, in my case DevOps and observability domains by sharing knowledge about tools, best practices, design patterns, etc. I also keep watch on the community pulse to make sure our own products meet the needs and desires of the community. I make sure it's a bidirectional channel where I can bring in the actual feedback and voice of our users into our company practice.

How do you see the place of logs in monitoring and solving issues?

Logs are an essential part of monitoring obviously, maybe the oldest and most established method of understanding why things happen in our system, especially why things go wrong. This is due to the fact that the developer who wrote the specific piece of code, essentially creates the output for what is going on in that piece of code. Therefore logs are just a very rich and verbose piece of information, and are the basic foundation for monitoring. It is important to say that logs today are not enough. You need to obtain fuller observability. Logs are one essential pillar, but they are usually accompanied by metrics and traces as well. These are the classic pillars of Observability upon which, together with potentially additional signals, one can get the broader picture of what goes on in the system.

Where do you see logging platforms in 5 years?

Logging has traditionally been very focused on the human aspect of the users. As I said, the developer outputs what goes on in the business logic that he wrote. Usually, it was outputted as plain text for humans to read. Plain text logs that are created for humans to read, they were unstructured and simply not scalable. These days when you have such a massive amount of logs in today’s distributed systems and microservices, we must use automated systems, and I foresee that these automated solutions will continue to grow and develop and we will see that people will be increasingly using log management systems and automation to aggregate, analyze and visualize log data. For that purpose we will see a growing shift going from unstructured to structured formats, plain text to machine-readable formats such as JSON. We will see more work toward log enrichment with metadata in order to attain better system insights, we will see more advanced centralized log collection, ingestion, indexing, and management. Instead of developers having to traverse hundreds of servers, there will be one centralized place where one can visualize, analyze, register, and create automatic alerts based on the logs. This shift is already underway and will accelerate. Going beyond that, as I said, logging will become much more integrated with the other signals in the observability domain, everything from the correlation between logs and metrics, logs and traces, as well as traces back to logs, and by traces I am referring to Distributed Tracing. This is another way in which I foresee logs will be integrated with other signals and events. The final direction perhaps in which I see for the future development of logging is through AI and machine learning. I believe that they will take an increasingly larger role with respect to analyzing and processing logs efficiently as well as proactively because as opposed to the constraints people face when attempting similar processes, AI and machine learning systems have the power to develop and advance incomparably faster.

I know that you are a big champion of Open Source. On your LinkedIn profile you write that your passion is: Tech, Innovation, and the power of communities & open source. I would like to hear your reasoning behind this, but maybe you can start by talking about what limitations you experience with Open Source.

I am a great advocate of Open Source. It’s hugely popular. Many developers already have the skill sets, so you have lots of users who are very familiar with the platforms, and a massive community pushing it forward. There are however several issues with it. The first thing that comes to mind is a common misconception. Often people think Open Source is equivalent to free. It is not zero cost. Yes you may not need to pay for a software or service license however you still need to invest in developers, devops, to install, operate, manage and scale. It is important to understand this. Many times new startups will begin with Open Source, as it is relatively manageable and cheap, however as they scale out they realize that the do-it-yourself model of Open Source is not as trivial as the organization scales out.

Another thing that I often encounter with individuals who are just starting to use Open Source, is as they adapt it to use in production, they realize that Open Source projects are really focused on one core capability. They put less focus on peripheral or administrative capabilities such as user and role management, team collaboration, single sign on (SSO), easy deployment, and so on. These features, I call them commercial grade or enterprise grade, and are not usually an inherent part of Open Source Software, but are needed to run things in production environments. Some vendors develop these additional capabilities on top of the open source project: so Grafana Labs or Elastic, or my company Logz.io develop an additional wrap-around to Open Source to provide another layer of enterprise grade capabilities that is applicable for businesses in production as well.

Recently there has been a security breach with log4j, which is also based on Open Source. Is Open Source less safe than Closed Source?

The Log4j CVE was definitely painful for many of us, including for us in my company. Actually many Java products are based on log4j, but we are happy to say that Logz.io is based on Logback, so we are not actually users of log4j, so specifically for us it was pretty smooth all things considered. Then again, the claim that Open Source is less safe would be one that I would have to disagree with, in principle. I believe the contrary is true. Open Source is safer than closed source. At least the popular Open Source projects are less prone to bugs and security vulnerabilities than closed source. That is thanks to the transparency and involvement of the vast user base and developer community that are constantly detecting, advancing, and fixing issues together. I understand that log4j had this bug for quite some time and no one detected it. However in commercial products the bugs are no less severe, perhaps they are much lower profile only because they are being detected and managed behind closed doors, whereas log4j was Open Source. For known CVE’s out there, I think over 90%, you can see patches and releases out there already, so the turnaround of the community is often much faster than commercial products. I definitely feel very comfortable with the security of open source, and as a developer community and community of software owners, we must remember that at the end of the day it is our responsibility to manage the dependencies and control them just as we need to do for licencing because it is ultimately our architecture and thus our responsibility to mitigate all this.

Elasticsearch has changed their licensing model. What does it mean for the user community?

Elasticsearch has become widely popular for log management and analytics, open source under Apache 2.0 license. Less than a year ago, Elastic B.V. the company that owns and is backing the elasticsearch project has decided to relicense elasticsearch and Kibana to a non-open-source license, it is actually a dual license, SSPL and Elastic License, bottom line, it is non-OSI license (OSI being the organization that essentially defines and validates the open source licensing). For the users, this essentially means that those who were counting on the open source being something they would be free to modify the code and adapt it to their needs, this is no longer the case. So, some users are fine using it as is, closed source. For others, it is important to have the flexibility and freedom to make these sorts of changes. Those who care about continuing to develop and better the software through the community, this will no longer be the case for elasticsearch and kibana. The other pieces of the ELK Stack, if you use the client libraries and the Beats, for example, filebeat, metricbeat, logstash and so on, are still Apache 2.0, however it is important to note that even there they inserted all sorts of version checks to verify the version of the elasticsearch cluster to which they ship logs. This is a breaking change, so if you don’t work with an approved distro, or even an older elasticsearch open source clusters (Elasticsearch 7.10 or earlier), it may break so you won’t be able to actually ship your logs to your elasticsearch distro anymore. So, it is a problem and the community has had adverse reactions. For example the community, after seeing this, then gathered around a fork of elasticsearch and kibana, it’s called OpenSearch, which is backed by significant vendors, the most prominent one being AWS, or Amazon Web Services. My company Logz.io is part of this endeavor, whose goal is to keep elasticsearch and kibana open source. So OpenSearch is really an independent project that started off as a fork, and it is also a very interesting path forward for those who like elasticsearch but who wish to continue using open source.

You work at Logz.io, can you tell us what Logz.io offers?

Logz.io offers a cloud native observability platform that is based on popular open source tools. These include elasticsearch, as we mentioned, now OpenSearch, Jaeger, Prometheus, OpenTelemetry, and others. Essentially, we provide you with the ability to send your logs, metrics, and traces into one managed central location. There you can search, visualize, and correlate across your different telemetry data. So you can correlate your logs with your metrics, your traces with your logs, and so on in one central place. As I said it’s all based on open source so if you are already familiar with the Kibana UI or with Jaeger UI or with Prometheus and Grafana, you won't need to learn some proprietary UI or APIs or formats or query languages, it’s all based on open source formats that you already know and are familiar working with.

Where do you see product quality going in the future?

I think the most interesting paradigm I see is the shift of responsibilities towards engineers. Engineers are owning more of their respective features all the way to production deployment and beyond. Which means, we need to make it easy and accessible for engineers to understand the piece of software that they wrote and how it will behave in production and then once it’s in production to be able to monitor and make sure the quality of the product is maintained. This is why I am very passionate about observability. I believe that observability will play the role of the hero in enabling engineers to have at their fingertips the power to understand the telemetry and state of the system at any given time. They will be able to understand trends over time, even historically. By the way, with Logz.io we understand that you cannot separate the issue of security from devs and DevOps practices, these are currently being called DevSecOps, and they are becoming very integrative. So even down to understanding how my system is vulnerable, and including all of this under one single pane of glass. This is how I see enabling the product quality starting from engineering and going all the way to production and beyond.

Do you find that there is a difference in user sensitivity towards poor product quality between different age groups or across different countries? Has it developed over time?

I think we as consumers have grown used to better user experience and new services. If you look at Saas services, on-demand, PLG (product-led growth), such as Netflix, etc. This user experience as consumers has educated us to expect a certain level of quality from the products that we use, even in our business interactions. This is why I believe that younger generations who are more exposed to newer SaaS offerings, are more informed, educated, and accustomed to these high levels of services. However, in general we, as a population are becoming much more keen in our expectation to receive a high level of quality in our user experience and this is something that we will see become very prominent. This is a nice segway to mention my podcast, OpenObservability Talks, because I am actually going to have an episode this week devoted to SaaS observability which will discuss how SaaS observability is key to enabling this level of quality of experience with SaaS products.

Do you have a dream tool that hasn’t been developed yet?

Well, I have many but I guess the one that is most relevant for these cold winter days that we are having here is a tool that will be able to turn on the boiler on time so that I can have a hot shower when I get home. Certainly for my children, this would be the one that would have the most impact these days. Perhaps an app that would be able to help you detect and avoid exposure to the areas with the highest Covid levels. These are the two tools that would be most useful these days.

It was great speaking to you, you gave us an eye-opening perspective on logs as well as on the subject of open source software. As a developer I have always appreciated open source, and as such Shipbook is open source on all levels, including our SDK, so I found your input very interesting. Thank you for your time.


Shipbook gives you the power to remotely gather, search and analyze your user logs and exceptions in the cloud, on a per-user & session basis.

· 11 min read
Yair Bar-On
Elisha Sterngold

Yair Bar-On

Interview with Yair Bar-On | Serial entrepreneur whose company, TestFairy, was acquired earlier this year by Sauce Labs

Yair Bar-On is a serial entrepreneur whose company, TestFairy, was acquired earlier this year by Sauce Labs. TestFairy is a mobile beta testing platform, handling app distribution, session recordings, and user feedback, in enterprise and secure environments.

Beta Testing is an important part of overall app quality and therefore we are very pleased that you agreed to join us for this interview for our blog, which focuses primarily on different aspects of app quality.

Please tell us about the background and history of TestFairy.

TestFairy was founded by myself and my co-founder, Gil Megidish back in 2013. We started the company after developing mobile apps in our previous company where we had some quality problems that we needed to solve. We had customers in the field with problems and we tried to solve those problems remotely, we had no idea what was happening over there, and that is how TestFairy began, by solving a real problem. Today TestFairy helps large companies manage their mobile development lifecycle. We do quite a few things across the development lifecycle. It starts with app distribution, which is a process of helping developers put their apps in the hands of users and help them with their beta testing. We can then record videos of exactly what your users are doing with your app. We have in-app feedback capabilities, allowing users to report bugs from the field, and in production we help customers with Remote Support and Remote Logging. So, in other words, with TestFairy you can have testers or real customers use your app, and you’ll be able to solve problems and have bugs reported through a very user-friendly easy interface. All this is just the beginning. We have recently joined Sauce Labs, which is the leading provider of quality software and digital confidence. Sauce has a very powerful service providing developers with real mobile devices in the cloud, that you can use for your testing, as well as emulators and simulators that you can use to test your apps automatically. TestFairy joined Sauce Labs to enrich the offer for mobile developers.

After getting acquired by Sauce Labs, you went from being a small independent company to being part of a much larger organization. What influenced your decision?

Right at the beginning of our talks Sauce Labs has inspired us with their vision. Sauce has acquired five companies over the last year, and you can only guess that more awesomeness is coming. The idea is to expand and become a one-stop-shop for all your digital quality needs. The world relies on code, and you need to make sure your apps, websites, and digital services are all properly functioning. Businesses need digital confidence. Your product needs to work 100 percent of the time. You can’t have your app at a B rating. Anything less than excellent is just not acceptable. What Sauce does is help you test your digital assets, end to end, in a very efficient way, allowing you to test your mobile apps on real devices, on emulators, and on simulators, as I previously mentioned. We have recently acquired API Fortress, which is now a very important part of the Sauce platform. It allows you to test the server APIsthe ones that are used to communicate with your apps, so that your testing is no longer limited to the front-end alone. Another company that joined Sauce is Backtrace, who is the leading crash reporter and error handling solution for mobile, web and gaming consoles. Many of the biggest gaming companies in the world use Backtrace. Crashes are not just about getting a stack trace, and fixing a bug. You need to see trends, and real-time information that can help you understand your users and where they are encountering difficulties. Taking that information and connecting it to your pre-release testing is super powerful and this is what companies are looking for. Imagine you are able to look at a crash and a minute later fix your tests to make sure that this crash will not happen again. All that can be done in real-time, not to mention AI and machine learning capabilities. Another service recently acquired by Sauce is AutonomIQ which is a low code environment that allows people who are not developers to build test automation for services that are used by their company, like Salesforce. The people who write those tests and build them don’t have to be engineers, they can be analysts, they can be product, they don’t need to learn how to code, they just need to know their systems. The last one I’ll mention, which was the first acquisition chronologically, much earlier on, is Sauce Visual. The Sauce visual testing platform allows you to test how your product looks across versions, across environments, platforms, and devices, so that you can look for visual problems during your regular testing.

Looking at Sauce’s impressive portfolio, you can understand why I mentioned that this was inspiring.

Are there any specific issues when it comes to mobile app quality or do you see mobile apps the same way as all other kinds of software?

Absolutely. I’ll start by saying that by definition, mobile is remote. If there's an issue with your app it is always happening somewhere else, not at your desk, or on your screen so you can’t open up a new window and inspect an element and see what is happening on your mobile device on Chrome. Issues happen on a mobile device somewhere in the hand of a person that in many cases you don’t know and cannot communicate with, and under these conditions you need to start solving a problem. That is the beginning. Second, the mobile environment is extremely fragmented. You have so many Android devices, and so many iOS devices, across hardware and software configurations, different levels of OS versions and locals, and this is before we get to the mobile device itself that needs reception, wifi, battery, and more. Mobile is just so much more complicated than web or desktop development. Whenever something goes wrong, the person reporting the bug has a lot of work. They need to take screenshots, they need to pull out logs from their devices, to explain what they did. These are some of the things we are able to solve at TestFairy that help mobile testing be done properly. Together with the things that Sauce Labs has built a powerful platform we manage to make developers' lives easier.

How do you see the relationship between Beta Testing and QA? Can good Beta Testing make companies save on their QA?

There are lots of stages in quality. First, we have to split the subject of QA into two parts, there is automation, and there is testing done by real people. The world of automation is very important for any company we speak to. Companies test their apps with many technologies including Espresso, XCUITest or Appium or on the Web with Selenium and other tools. I don’t think you’ll find companies that don’t do any automation. On the other hand, you have manual testing done by real people, which is not going anywhere, and this incorporates a number of stages. Some companies look at alpha, beta, delta testing and so on. Others will look at QA and dogfood. These are all different stages that are done by different stakeholders in the organization. The typical QA will be done by QA professionals, who are people that work inside the company whose profession is quality. They will test your app or your product manually and automatically. Their job is to find problems. Beta testing, or as we call it “dogfood”, some companies call it “catfood”, or even “monkeyfood”, there are lots of names for “dogfooding”. “Drink your own champagne”, is another term that is very popular. These are terms relating to companies with a process by which company employees use the company app in order to look for problems before the app is released to production. We work with many of the largest companies in the world and help them with their dogfood process. One example that I always like to mention is Groupon. Groupon has thousands of employees who use TestFairy to manage their worldwide internal beta testing. They actually call it “catfood”. Their internal process allows any Groupon employee in the world to report bugs directly to the mobile team in Chicago, in real-time. All they need to do is shake their phone, sketch on a screenshot, and hit the send button. That bug report goes directly to Jira, that is used by the R&D team and they get bugs in real-time. This allowed people to report bugs in a much more convenient way than before and it allows developers to see and fix bugs faster. It is very important to make bug reporting easy. We spoke to lots of companies and asked users if they had a case where they had a bug that they found during internal testing, but that was not reported, and then the same bug showed up in production. The answer was yes in many cases. When we asked them why they didn’t report the bug, the answer was either, it was too complicated to report, or they didn’t have time and they couldn’t be bothered with conference calls or follow ups, or they didn’t want to report the bug at the time since they were sure they knew about it. Then when we showed them TestFairy and for them it was just a life saver, because reporting a bug takes seconds. All you need to do is shake your phone and hit send, and the bug will appear on Jira.

What is special about beta testing is you can do it with people who are not technically savvy. You can do it with literally anyone, the people in finance, or the warehouse manager, operations department, whomever. They are not technically trained, you wouldn’t necessarily talk to them about your mobile app development, but they think like your customers, and they work in the company and want your company to succeed. If you will let them help you test your app, they will very likely be helpful in finding problems and be willing to report them in real-time.

There is a lot of shifting left. Developers do more. And we see a lot of quality going to production. Some of the trends I think we’ll see more and more of is that quality signals from Prod will go back to the development process and the automatic testing process that is done pre-release and will connect, automatically. We hear that from many of the Sauce customers. We see this in the questions we get from our largest clients who built their development process for the upcoming years ahead. I think that this will be a significant trend that we will see evolve.

What is the importance of logging in Beta Testing?

TestFairy can collect logs from remote devices. So if your app writes logs and you want to get logs and put them in your central logging server, TestFairy can help with that. Some of the biggest players in logging are Sumo Logic, Splunk, Coralogix, Log4J, Logz.io, and many others. If you want your logs from all your remote mobile apps to be sent to your logging server, you can do that with TestFairy.

So TestFairy is an intermediary between the mobile apps and the cross-platform logging service providers?

Correct.

Do you have a dream tool that hasn’t been developed yet?

Yes… but I can’t tell you about it. Because if I tell you, it won’t be a secret any more :)

True… true.. Thank you very much for your time, and for sharing your expertise with us, it was very eye opening. You gave us a different perspective on the ways in which companies, and especially larger companies, ensure their apps maintain high quality.


Shipbook gives you the power to remotely gather, search and analyze your user logs and exceptions in the cloud, on a per-user & session basis.

· 7 min read
Elisha Sterngold

There are three main methods for getting feedback on mobile app behavior: capturing crashes and non-fatal exceptions, capturing user and system events, and generating logs. Each method on its own provides just one piece of the puzzle. It is only when they are all used together in an integrated manner that developers can effectively deal with the exceptions, errors, and issues experienced by the app users.

However, in the production environment, logs are generated on the device that is running the app and are thus not readily visible to the developer. In this blog post, we give hands-on examples of why and how to add the third, crucial pillar to complete the analysis and fixing of app issues in the production environment: logs.

· 4 min read

Logs Help Solve Mysterious Car Accidents:

tesla automatic car image (Image credits: https://www.tesla.com)

Let’s take a look at a speeding car, minutes before the accident. The vehicle is driving at a high speed, and the driver starts to depress the brake pedal. At what point is the automatic emergency braking function activated? If not immediately, when does it take effect? How much effect does it have on the velocity of the halting car?
Tesla’s automatic car system was first introduced in 2014 and as of May 2021 the advanced autopilot system was released to a few thousand Tesla owners for testing. Since then, there have been a number of collisions and accidents that have put a tremendous amount of pressure on the company, from the public as well as from family members of the victims. Luckily, or shall we say, thanks to responsible company practice, Tesla’s cars log every drive so that each action and reaction of the car’s system is uploaded to the cloud. This makes finding the cause of accidents as simple as clicking a button.

· 7 min read

What Did GDPR Change?

gdpr protection cloud image

Prior to its coming into effect, a directive governed what companies could and could not collect about their customers and users. The issue with a directive is that it allows each of the member states of the EU to adopt and edit the directive to fit their needs. The GDPR in comparison, must be accepted in its entirety by all member states of the EU. It also applies to companies located outside of the EU, but with activity within the EU. In short, the ratification of the GDPR has made data protection more expansive, up-to-date, non-negotiable and compulsory.

· 4 min read

captain work from home corona image

Challenging Times Call for Extraordinary Measures

Times are challenging and in many parts of the world even frightening. Both health wise and on an economic scale.

Almost everything seems to have stopped. International flights have certainly stopped. Many stores, building projects, hairdressers and so on are not able to continue their businesses for the moment. Like with so many other things, the stalemate is spreading like rings in the water.

We are all hoping and waiting for this to pass and start working as usual again. One big question is of course what we do in the meantime. Only a few companies are daring to develop new products and services during such times. The risks are high and many find it better to sit tight for the time being.

· 6 min read
Avishag Sterngold

HOW TO PROTECT THE CUSTOMER’S PRIVACY WHILST FIXING PROBLEMS IN A MOBILE APP?

This blog is not intended as legal advice

GDPR and logs image

Are you the type of person who likes everyone to know everything about them? Or are you the type who is careful that all information about them is deleted?

The truth is that it’s not so important which group you belong to - what’s more important is that you are one of those who understands that mobile logs contain important information which is gathered from the user – and it’s not just ‘any’ information.

· 4 min read
Elisha Sterngold

Is Crash Reporting Enough?

crash reporting is not enough gif

In the mobile app development world it is very common to use Crash Reporting Tools. But it is much less common to use Log Management Tools.

Developers view a crash in the app as a top priority that has to be fixed.

There is no doubt that a crash in the app is very disturbing for the user experience of the app. But, it isn’t the only thing that disturbs the user experience.

· 5 min read
Elisha Sterngold

History

logs in a pile debugging vs logging image

In the early days of computer programming there were no good debuggers available that helped you debug the program step by step, therefore the easiest way was to print it in the console.

Even when there were better debuggers they were not well integrated into an IDE so it was much easier just to write printf and to get the information thru the console. But once the developer has already written many printfs/logs, why not just save the console output so that the developer will always have this information when needed.

· 7 min read
Elisha Sterngold
Eran Kinsbruner

mobile error log

Intro

In the software development world, when developers want to understand why something doesn’t work in the program that they developed, the first place to look is the logs. The logs give the developer a “behind the scene” view of what happened to the code when the program ran.

The question is why, in mobile app development, developers aren’t using the app logs to analyze app issues. Some even remove them before production, for example, in Android they use ״proguard״ to remove the logs.

· 3 min read
Elisha Sterngold

Log Severity Intro

log severity ruler gif

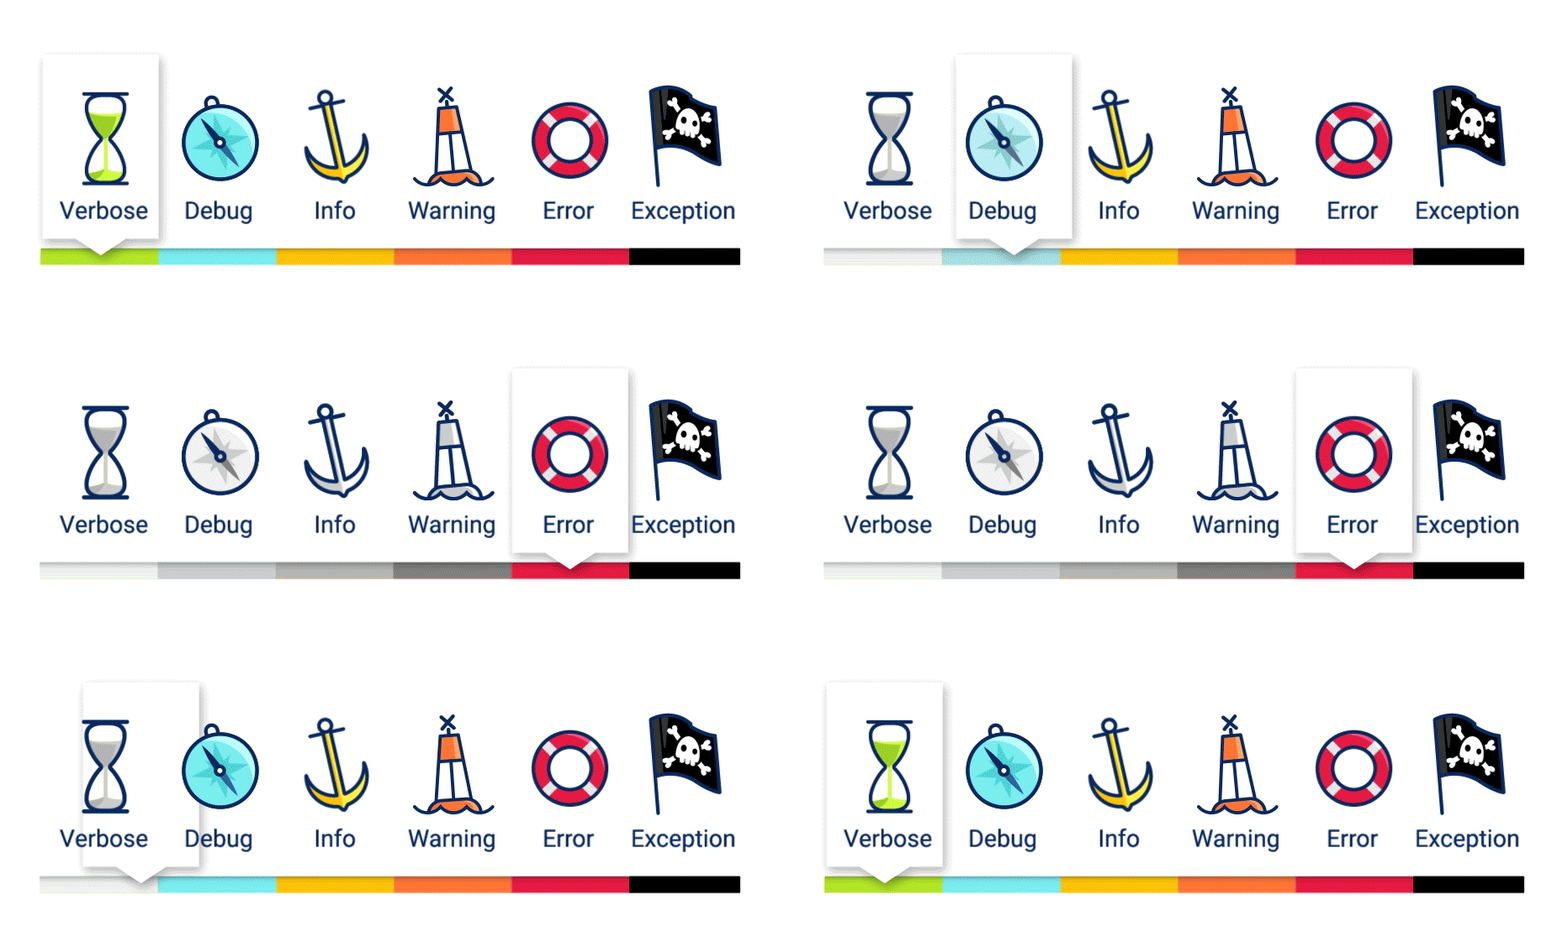
This subject may sound boring. Don’t all programmers know which log severity should be used? The answer is that people are not logging their app in a systematic way. There are several guides that explain the levels but they usually just define them. I’ll try to help you decide which log level should be used. I’ll give examples so that that you will be able to copy it into your app. I’m going to list the severities of Android.