Whereas once, software was assessed purely based on its functions and features, today, it also needs to deliver a pleasant user interface and smooth user experience. System crashes in software are undoubtedly one of the biggest factors, both undermining the software function and ruining user experience.
Unfortunately, tracking down crashes in software—a task essential for meeting these new demands—has been one of the most notorious activities on a programmer’s agenda. And it’s no wonder: How often did you have to investigate an obscure bug that happened once and stubbornly refused to reveal itself on your development device?
The vast majority of crash reports developers have to deal with don’t have clear steps in order to reproduce them for a quick fix; many of them happen because of tricky race conditions, memory corruption, and the like. Troubles associated with crash fixing have led to creation of tools that help with logging all relevant information from remote devices, the most famous and widely used of which is undoubtedly Crashlytics.
Crashlytics was founded in 2011, and its huge success led to the company’s acquisition by Twitter in 2013. A short while later, the product was expanded into a set of services known as Fabric. Finally, in 2017 Fabric was acquired by Google, and in 2019 Crashlytics became the shiny diamond of the family of services called Firebase.
Nowadays, Crashlytics is available for native iOS and Android apps, as well as Flutter and Unity applications. Let’s look at why it became so popular by diving into its features.
Crash Reports
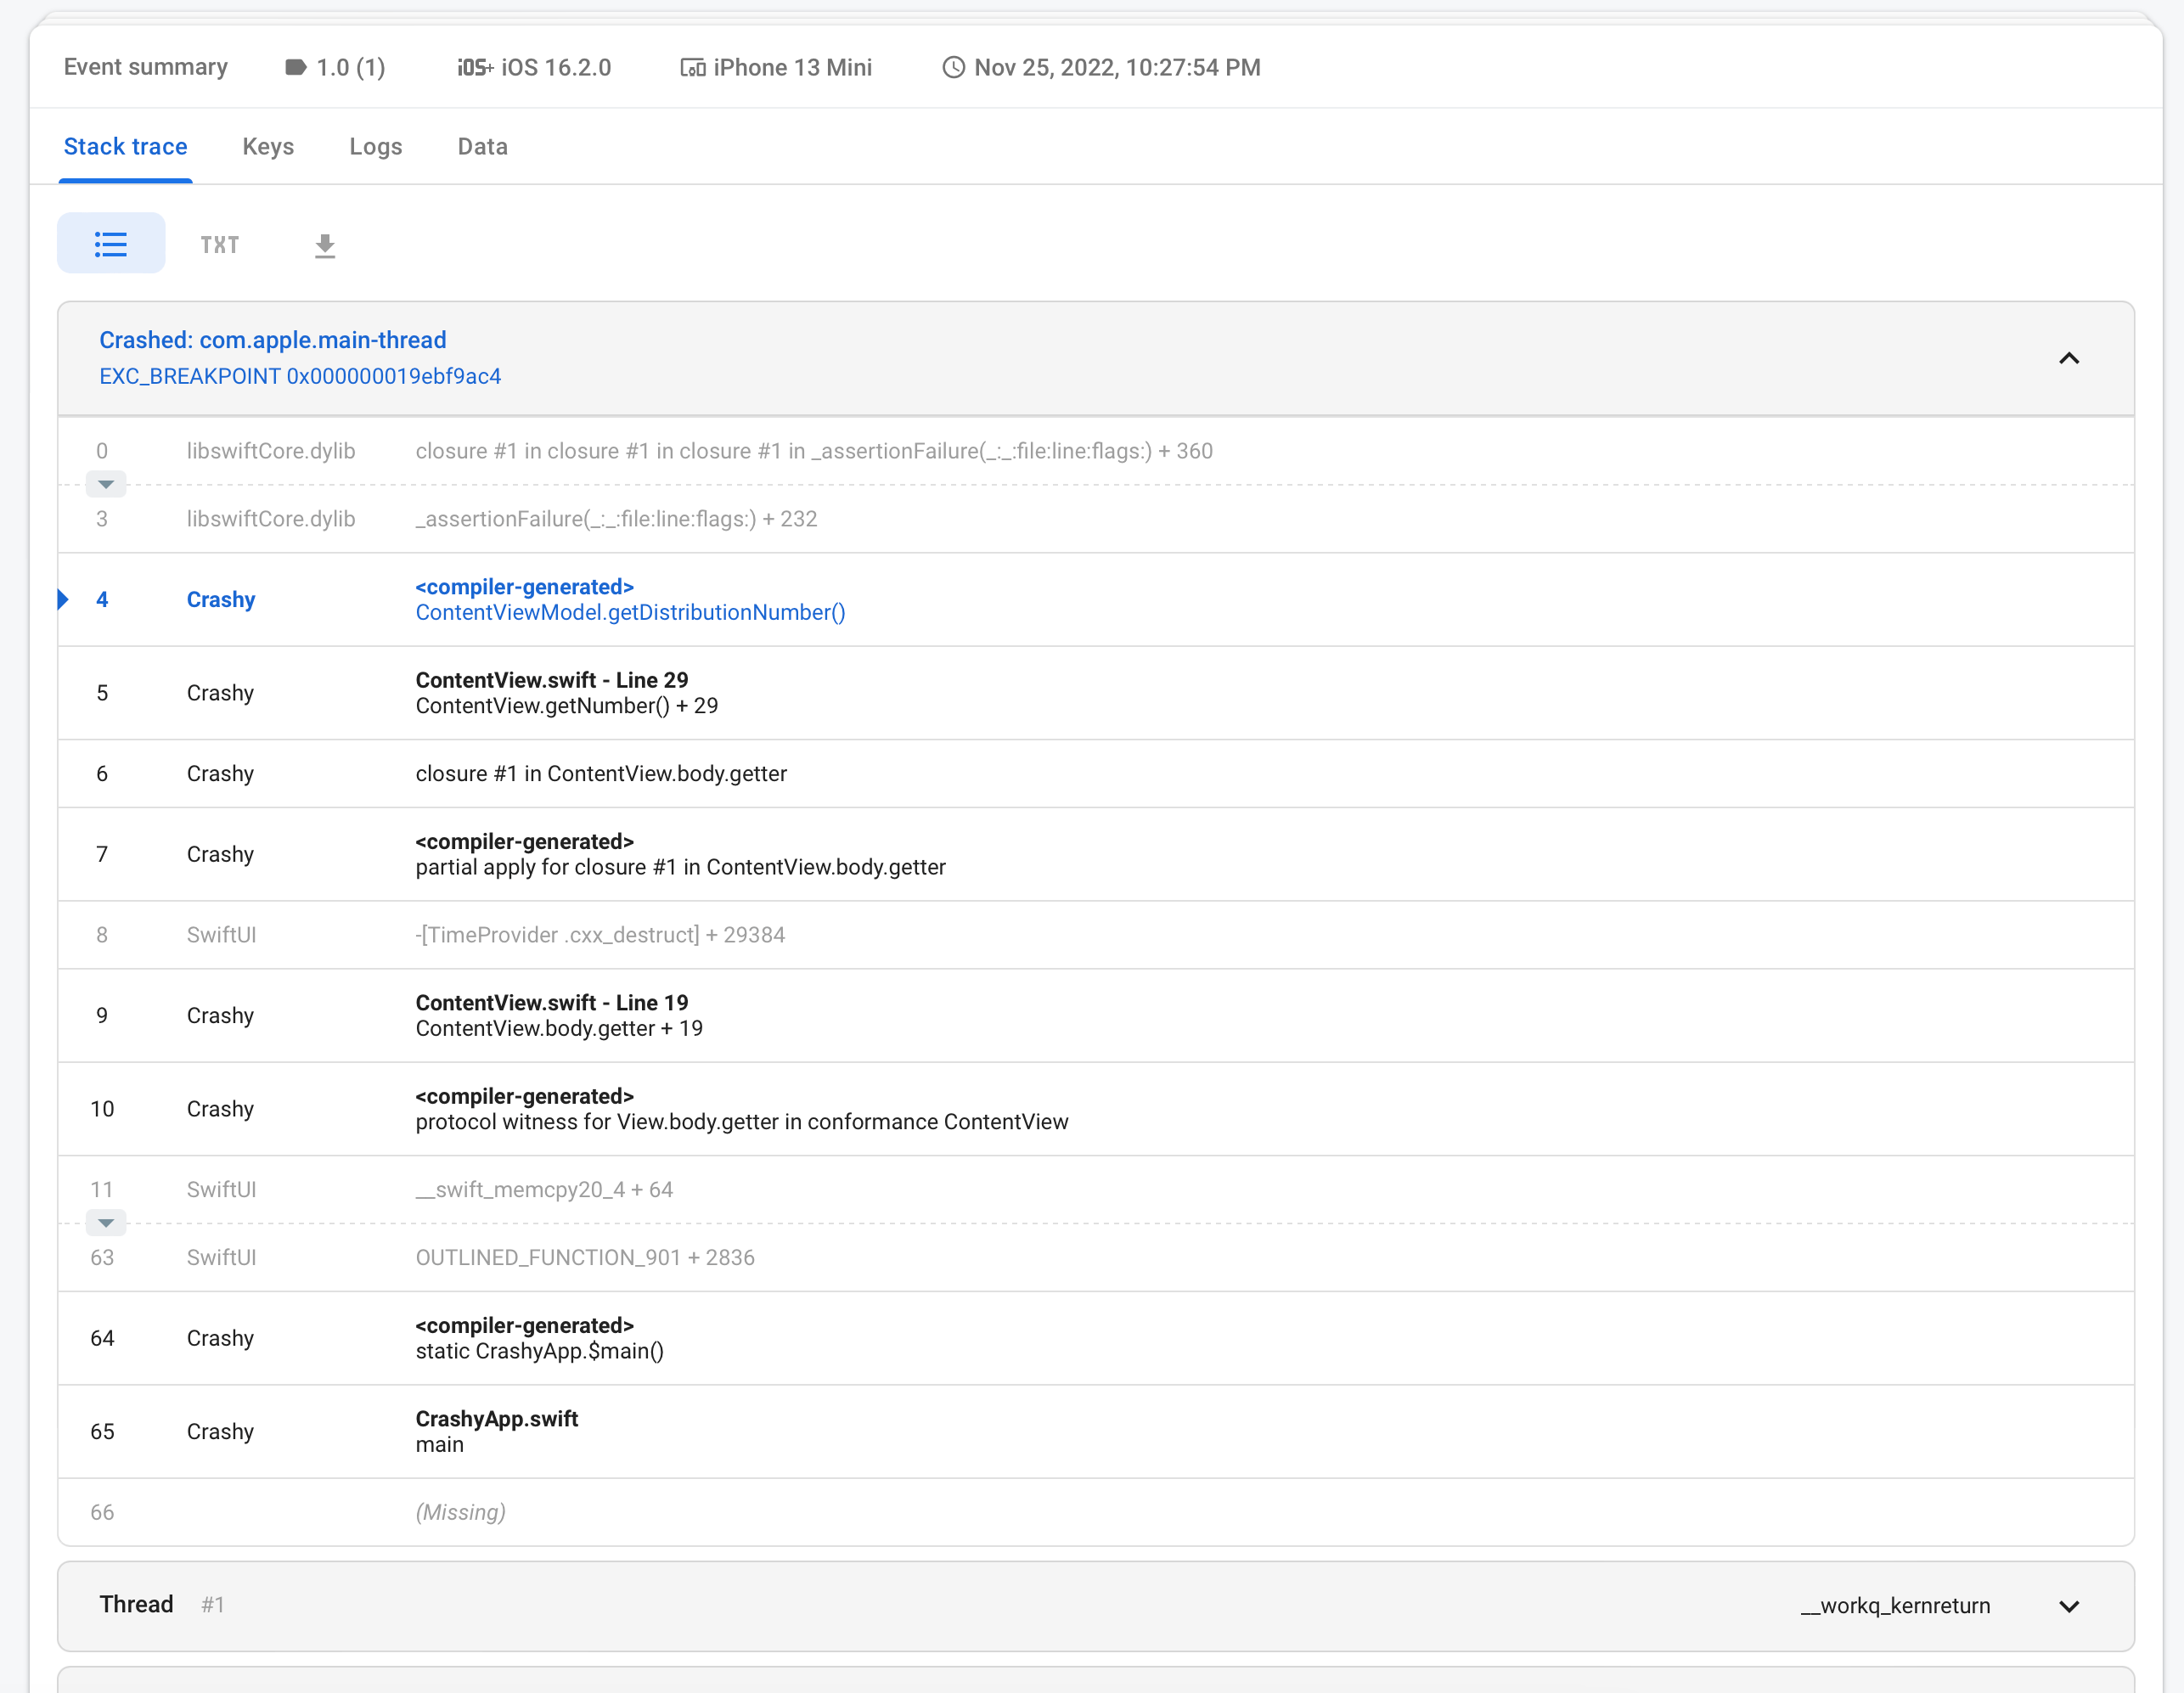
Of course, the main reason people use Firebase Crashlytics is crash reports. If the app crashes, the stack trace, which led to the crash, and all relevant information will be visible to the app developer in the Firebase Crashlytics web interface. Figure 1 shows what a crash typically looks like in the Crashlytics Console:
 Figure 1: A typical crash report
A stack trace is a sequence of function calls that ultimately lead to the corresponding exception. In multi-threaded environments, information about function calls is gathered for all threads, not only the one that crashed.
Beyond the stack trace, reports contain the exception’s name and description. For example, the captured exception from Figure 1 has a very simple cause: division by zero (see Figure 2.)
 Figure 2: The description of the exception caused a crash
Beyond the information received from the application, Crashlytics has an impressive knowledge base of common reasons for crashes. It analyzes reports and provides you with a suggestion of what might have caused the problem. This feature is known as Crash Insights.
Crash Metadata and Custom Data
Crashlytics gathers all information about the device on which an app crashed, such as the model, the operating system’s version, the date and time of the crash, and the state of the app (background or foreground.) However, the most valuable information is that which is relevant to the specific context of your application. For this purpose, you can add custom data to crash reports.
For instance, you can already identify which method caused the crash above, but what exactly is the reason for it? You can add custom keys inside the method in order to add values of variables that you’re interested in to the crash report:
    Crashlytics
      .crashlytics()
      .setCustomValue(number, forKey: "number")
    Crashlytics
      .crashlytics()
      .setCustomValue(total, forKey: "total")
(All code snippets in the article use the Swift programming language. The syntax of the API for Objective-C, Kotlin, or Java is similar.)
After that, you’ll be able to see your custom values in the crash report (Figure 3.)
 Figure 3: Custom keys in a crash report
Additional values attached to a crash report might give you an idea about the reason for the crash: These values could be a number of goods in the basket of an online store, an error code returned by your backend server, or whatever information you think might be useful for the investigation of potential bugs.
Crash Statistics
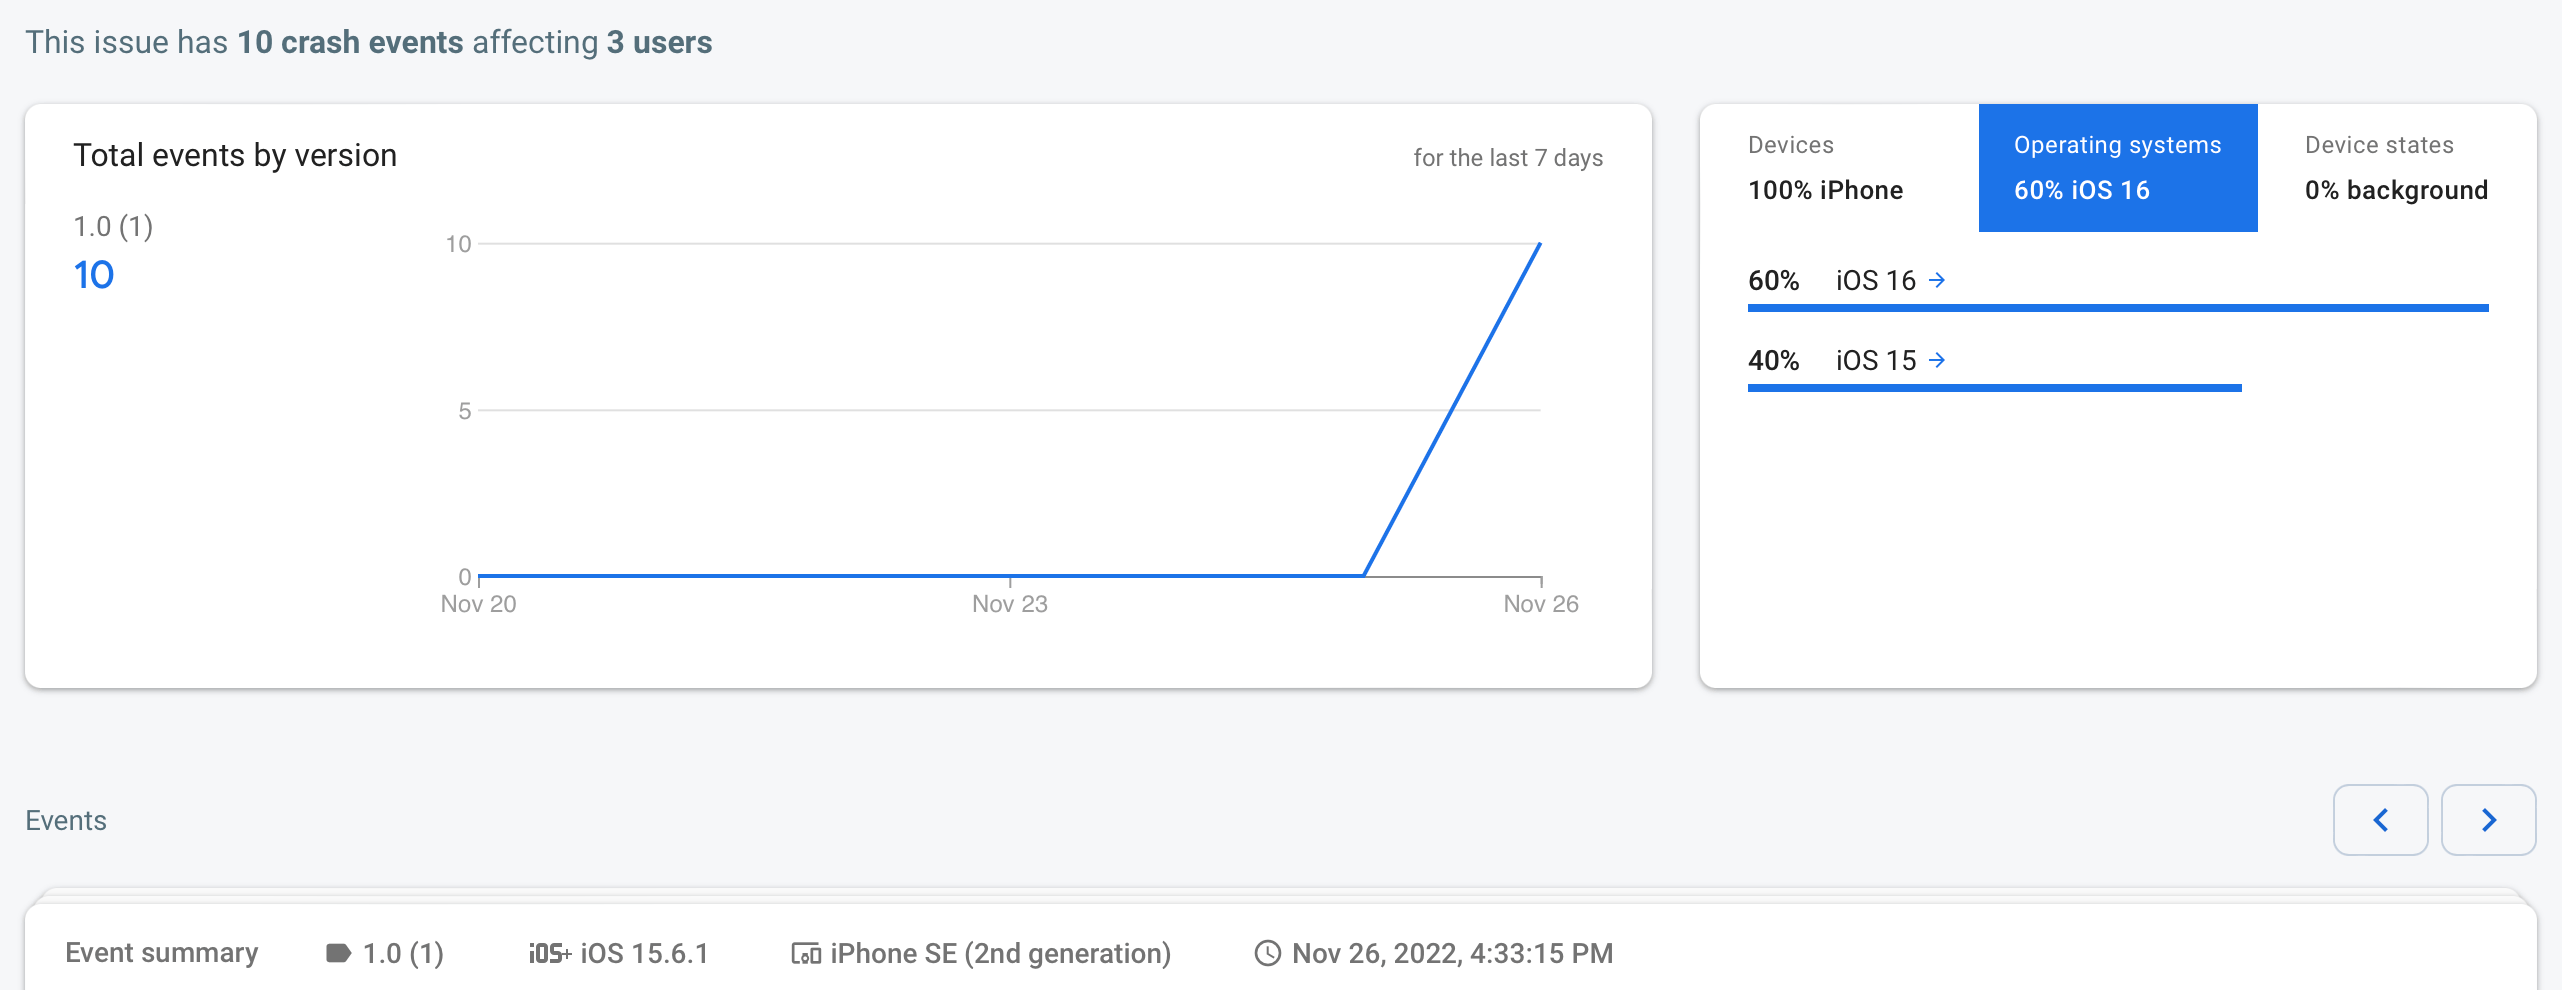
Firebase Crashlytics uses smart algorithms to group similar crash reports into a single issue. On the Console, you can observe full statistics: How many users have experienced the issue, the distribution of device models and operating systems, and so on (see Figure 4.)
 Figure 4: Crash statistics
In the stack trace area of the Console UI, below statistics, you can see all occurrences of the issue. This is helpful when investigating whether the crash occurrences have differences when comparing between various users and devices.
Crashlytics is also smart enough to group reports across different app versions, even if relevant source code changes slightly.
Breadcrumbs and Custom Logs
If your app integrates with another Firebase Service, Google Analytics, you typically receive an even higher volume of relevant data on your Console. In my experience, one of the most popular metrics is the percentage of crash-free users, which is often used by technical managers to measure application stability.
Another important advantage of integration with Google Analytics is that crash reports are complemented with predefined app events attached to each issue as so-called breadcrumbs—the sequence of user actions and app events that preceded the incident. Although automatically collected events are a good start, they are often not enough. In cases where you want to enrich reports with your own log messages, run this simple code line:
    Crashlytics
      .crashlytics()
      .log("Number \(number), total \(total)")
Your message will appear on the Console per Figure 5.
 Figure 5: A custom log message
However, this is only applicable to crashes, i.e., unhandled exceptions. Apart from that, Crashlytics allows the reporting of non-fatal errors and provides them with custom keys and log messages. Just pass any error or exception to the designated Firebase method, and next time the error occurs, it will be visible in the Firebase console:
Crashlytics.crashlytics().record(error: someError)
However, this isn’t enough for a full-fledged logging system. If you need to access logs from all user sessions, even when there are no crashes or errors, Shipbook offers not only standard remote logging capabilities, but also integration with Firebase Crashlytics. This allows you to observe your logs in both the Shipbook interface and Firebase Console in case of a crash.
Notifications
Finally, Firebase Crashlytics has a handy email notification system: It sends an email immediately when a new issue type is recognized, or when an old, closed, one re-appears in a new app version. Periodic reports on trending issues are also sent by email. Additionally, you will be notified if the service needs more information from you in order to generate and process better reports.
Conclusion
So, what is Firebase Crashlytics good for? The service is certainly the most useful tool out there for tracking crashes happening on end-user devices. The full stack trace, additional relevant data, breadcrumbs, and custom logs help with investigating the most tricky issues that are difficult to reproduce in your test environment. Firebase Console helps you to determine the root cause of an issue by providing you with full background information and insights.
Additional analytics allow you to group and break down various reports, and determine the severity of each issue. For instance, you may want to forget about exceptions that happen only in older device versions that are about to disappear from view. Regular notifications will guide you in your road map on the way to the crashless future.
Shipbook and Crashlytics
When it comes to gathering full logs and information about all user sessions in your application in order to improve user experience, Crashlytics alone won’t help you. Shipbook provides a simple yet powerful service to gather, store, and display full logs for your mobile applications, for both iOS and Android. Integrating Shipbook with your Firebase services and Crashlytics data will allow you to get the most out of Crashlytics to keep your apps running smoothly.
