
Introduction
In the dynamic world of Android app development, performance is crucial in order to meet the growing user expectations. Users demand smooth, responsive, and battery-efficient experiences, and they won't hesitate to uninstall apps that fall short. As developers, it's our responsibility to ensure our Android applications are not just functional but also performant.
We will be posting an exclusive series of articles where we go deep into the realm of Android performance profiling and optimization! Over the next few blog posts, we'll embark on an enlightening journey to demystify the Android apps’ performance. In this comprehensive series, we'll touch on the critical aspects of CPU usage, battery consumption, memory management, and UI optimization. Whether you're a seasoned developer seeking to fine-tune your app or a newcomer eager to master the art of Android optimization, this series is your roadmap to achieving peak performance. Get ready to unleash the full potential of your Android applications! 🚀
The Importance of Performance Optimization
Performance optimization isn't merely a luxury; it's a necessity. Beyond satisfying your users, there are several reasons to prioritize performance optimization in Android app development:
- User Retention: Performance issues, such as laggy UIs and slow load times, frustrate users and lead to high uninstall rates. An optimized app is more likely to retain and engage its user base.
- Market Competition: The landscape of mobile applications is crowded, and competition is fierce. An app that outperforms its peers has a clear advantage, which often translates to better ratings and more downloads.
- Battery Efficiency: Mobile device batteries are finite resources. An inefficient app can quickly drain a user's battery, leading to negative reviews and uninstalls. Optimal performance can significantly extend battery life.
- Resource Utilization: Efficient apps consume fewer system resources, such as CPU and memory. This, in turn, benefits the entire ecosystem by reducing strain on the device and enhancing the user experience across all apps.
In this article, we will explore battery consumption and CPU usage profiling and optimization. These two aspects are closely related. High CPU usage also leads to high battery consumption.
Understanding CPU Usage and Battery Consumption
Let’s first make sure we are on the same page regarding what we mean by the terms CPU Usage and Battery Consumption.
CPU Usage
The Central Processing Unit (CPU) is the brain of any computing device, including smartphones. CPU usage in the context of Android app performance refers to the percentage of the CPU's processing power that your app consumes. High CPU usage can lead to sluggish performance, increased power consumption, and a less responsive user interface. This happens as the CPU is unable to calculate everything which results to slow response times.
Monitoring CPU usage is crucial for several reasons:
- Responsiveness: High CPU usage can cause your app to become unresponsive. Monitoring CPU usage allows you to identify performance bottlenecks and optimize your code for a smoother user experience.
- Battery Life: As we already explained, excessive CPU usage can quickly drain a device's battery. By reducing CPU load, you can extend the device's battery life, leading to happier users.
Battery Consumption
Battery consumption is a key concern for mobile users. Apps that consume excessive battery are likely to be uninstalled or used sparingly. Why tracking battery consumption is essential:
- User Retention: Excessive battery consumption is a major annoyance for users. By reducing your app's power consumption, you increase the likelihood of user retention.
I personally tend to uninstall apps that are very battery-demanding.
Profiling Battery Consumption and CPU usage
The skill to identify performance issues is arguably more important than the skill to optimize. In the same way, the read code to write code ratio is estimated to be about 10 to 1, we should spend more time identifying performance issues rather than performance optimizing. At first, this sounds weird, but it actually makes a lot of sense. Nowadays, even mobile devices have become quite powerful and are able to handle effectively heavy-duty tasks. Furthermore, performance optimization often leads to code that is harder to read and reason about. Therefore, we shouldn’t spend time optimizing code that has little to no effect on the actual real-time performance our users have. We must, though, always keep an eye on whether we have serious performance holes that we are not aware of. The Android Profiler is an excellent tool to do that!
Android Profiler
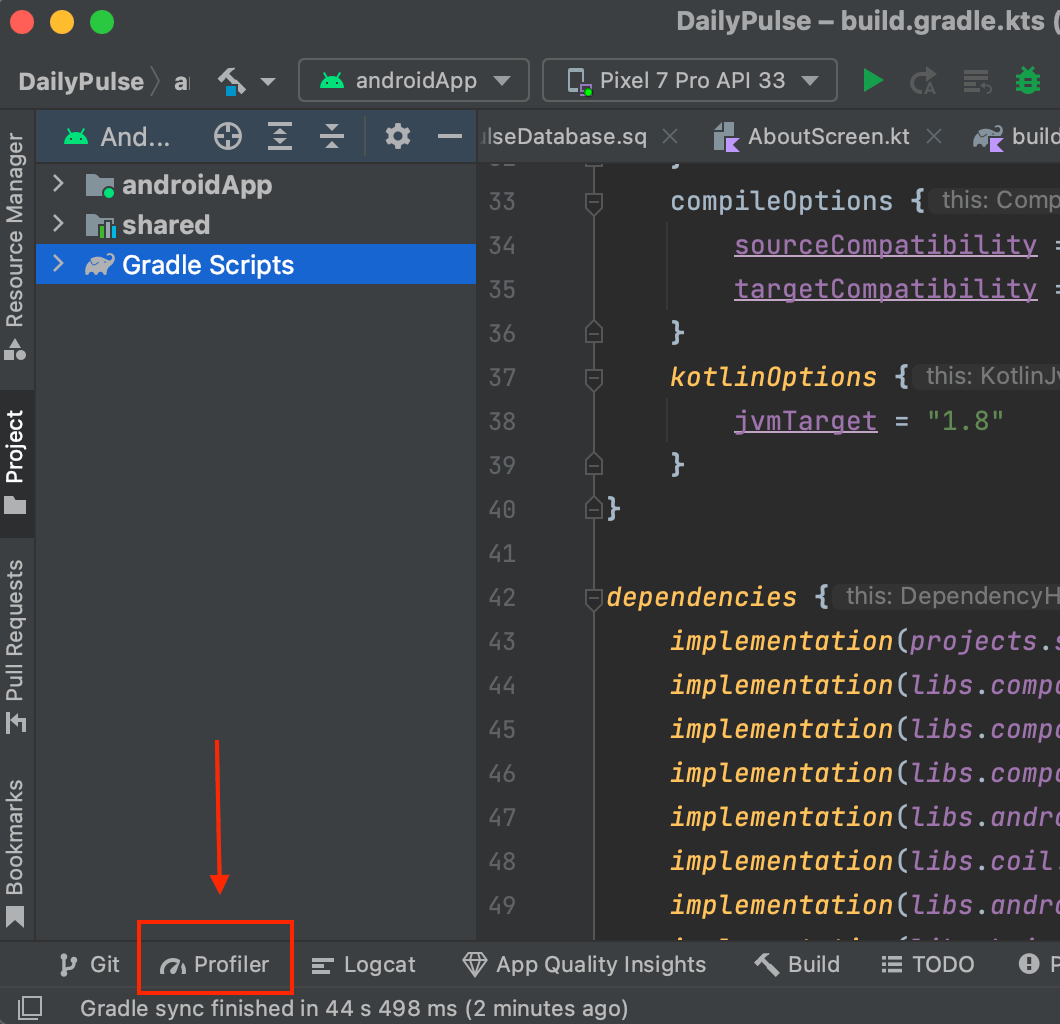
In order to start profiling an app, we first need to run the application from Android Studio in an emulator or a real device. When you have the app running, click the “Profiler” tab at the bottom of Android Studio:
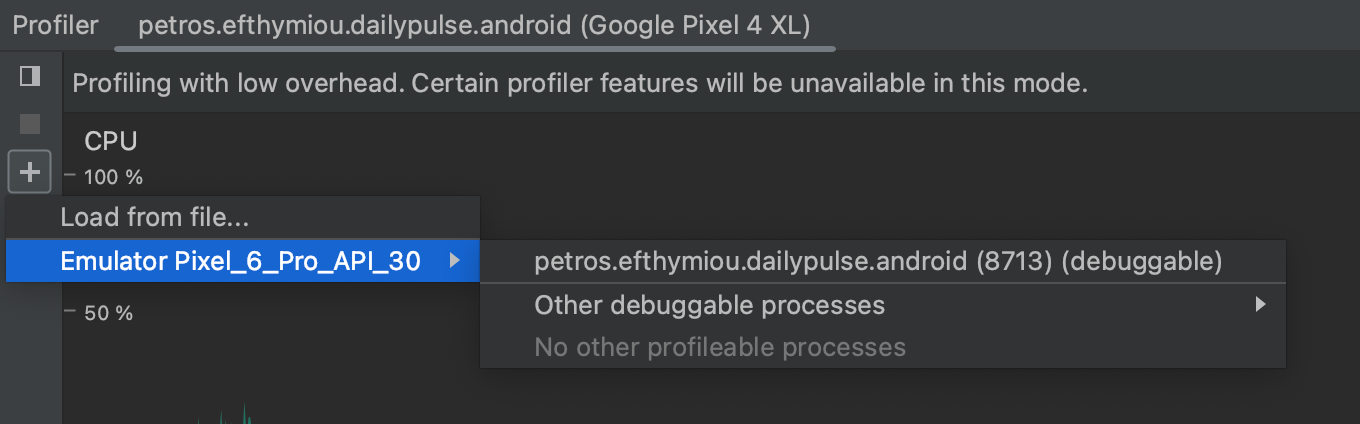
Then, you need to locate the device on which you are running your app and click the “plus” icon to start a new profiler session. Find your app (debuggable process) and click on it.
Monitoring CPU Usage and Battery Consumption
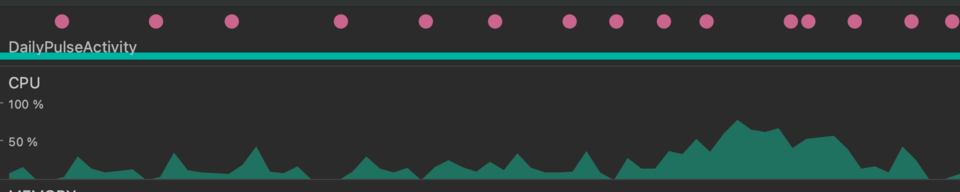
Once you select your application, you are going to see something like the screenshot below. The top section indicates the percentage of CPU usage, and the bottom section the memory that our application is using.

We are going to ignore the memory section for now as this article is focusing on CPU and battery. If we start using our app and navigate from screen to screen, we will notice that the CPU usage is increasing. Particularly when scrolling an extensive list that uses pagination, we can notice that the CPU usage is well getting above 50%. This happens because of the multiple network requests to fetch the next items as well as the lazy calculation of the UI items.
The pink dots at the top indicate the clicks we are doing inside the app.
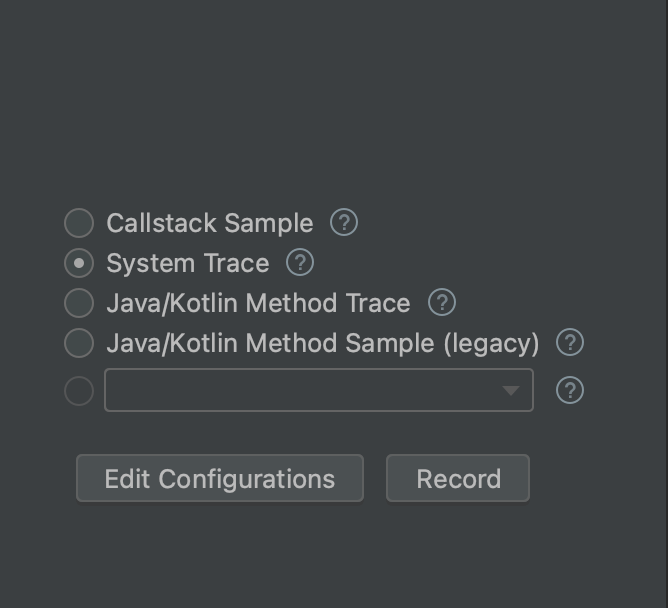
Now, please click on the System Trace Link. The system trace initially has 2 tabs, one for the CPU and one for memory. Please click on CPU, and you will be able to track the CPU usage in even greater detail.
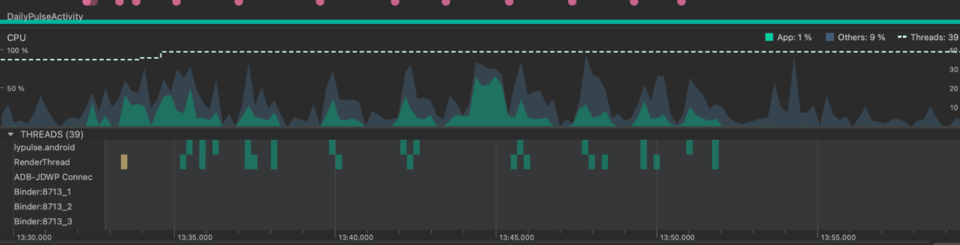
The green color indicates the CPU usage by our application, while the gray color the CPU by external factors such as the OS or other apps that may run in the background. We can also see the amount of threads that are currently active.
In order to track the battery usage, select on the left of the screen the system trace option and start recording.
You can now use your app and perform the actions that you are interested in profiling, like navigating inside the app or scrolling a list. Once you are done, click stop recording, and you will get a full profiling report. On the top of the screen, you can see the CPU and, at the bottom, the energy profiler with the battery consumption.

The “Capacity” represents the remaining battery percentage (%).
The Charge the remaining battery charge in microampere-hours (µAh).
The Current is the instantaneous current in microampere (μΑ)
I personally though prefer to focus on CPU usage, which I find more helpful and straightforward. Generally, as a rule of thumb, high CPU usage means high battery consumption.
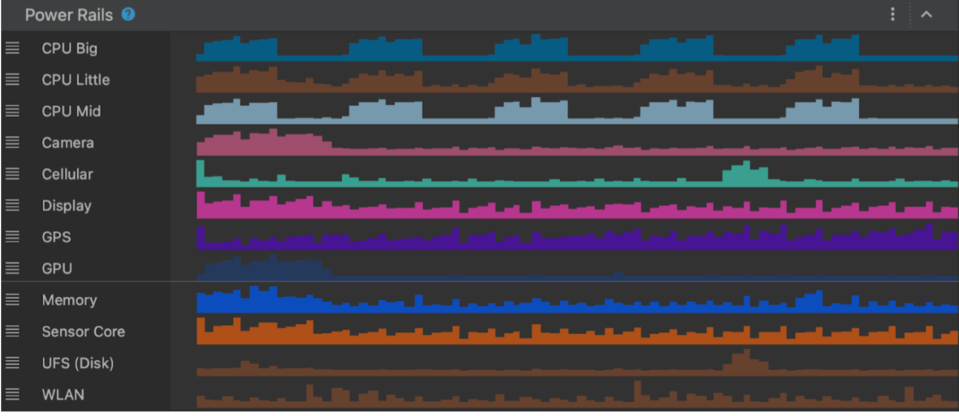
Besides CPU, though, there are other factors that contribute to battery consumption, such as GPU usage, Sensor core GPS or camera usage, etc. Unfortunately, in most devices, we are unable to get the detailed report as they don’t support the “On Device Power Rails Monitor” (ODPM). A few devices, such as Pixel 6 or Pixel 7, do support it, and the energy profiler there can give us the full battery usage report to understand further where we consume battery.
Another great way to understand if your application is consuming too much battery is to simply use it as a user and check the system settings report that indicates your app’s battery consumption over time.
We now clearly understand how to profile our app’s CPU usage and battery consumption, either during runtime or by recording and storing usage reports. Let’s move on to the next section, where we will learn certain optimization techniques.
Optimization
The general rule to optimize both CPU usage and battery consumption is to avoid any unnecessary work. When we optimize CPU usage, we also optimize battery consumption and vice-versa. The difference is that in terms of CPU usage, we must avoid “doing all the work at once” which will overload it and cause performance issues, while battery consumption is about how much work we do over time.
Below, we will present certain areas that can overload the CPU and cause high battery drainage.
Precalculations
We often precalculate information, anticipating that we will need to display it later. We do it so that the information is available to the user instantly, and the user doesn’t have to wait for it. In many of the cases, though, the user will never navigate to the anticipated area, and the information won’t be displayed. Resulting in wasted CPU consumption and battery drainage.
- Try to avoid prefetching data with multiple network requests at the application startup unless it’s really necessary. This can both overload your CPU, resulting at sluggish application startup, as well as unnecessarily drain the battery.
- Avoid precalculating list elements. Use either the recycler view combined with the view holder pattern or the Jetpack Compose lazy column. Those components are performance-optimized and only create the items when the user is about to see them. API pagination is also a great technique to avoid prefetching an extensive amount of data.
Background Services
Background services are essential for tasks that need to run continuously or periodically, even when your app is not in the foreground. However, they can also be significant contributors to CPU usage and battery drain.
Optimization Strategies:
- Scheduled Alarms: Utilize the AlarmManager to schedule tasks at specific intervals rather than running them continuously. This allows your app to minimize background processing time and conserve battery.
- WorkManager: For periodic and deferrable tasks, use WorkManager. It efficiently manages background work, respecting device battery optimization features and network constraints.
Wake Locks
A wake lock allows your app to keep the device awake, which can significantly impact battery life if used excessively.
Optimization Strategies:
- Use Wake Locks Sparingly: Only use wake locks when necessary, and release them as soon as the task is completed. Prolonged use of wake locks can prevent the device from entering low-power modes.
- AlarmManager: In scenarios where you need to wake the device periodically, consider using the AlarmManager to schedule tasks instead of a continuous wake lock.
- JobScheduler or WorkManager: These tools can be used to schedule tasks efficiently without the need for a persistent wake lock.
Location-Based Services
Location-based services, such as GPS and network-based location tracking, can have a significant impact on CPU usage and battery consumption, especially if they're continuously running.
Optimization Strategies:
- Location Updates: Request location updates at longer intervals or adaptive intervals based on the user's current location. High-frequency updates consume more battery.
- Geofencing: Utilize geofencing to trigger location-based actions when the user enters or exits defined areas. Geofencing is more efficient than continuous location tracking.
- Fused Location Provider: Use the Fused Location Provider, which combines data from various sources and optimizes location requests. It reduces the need for the GPS chip, which consumes more power.
Battery and CPU Efficient Network Requests
Network requests can impact the device resource’s usage.
Optimization Strategies:
- Batch Requests: Minimize the number of network requests by batching multiple requests into one. This reduces the frequency of radio usage, which is a significant battery consumer.
- Network Constraints: Use tools like WorkManager, which respect network constraints. Schedule network-related work when the device is on Wi-Fi or when it has an unmetered connection, reducing cellular data usage.
- Background Sync: If your app needs periodic data synchronization, schedule these tasks at intervals that minimize battery impact.
- Optimize Payload Size: Minimize the size of data payloads exchanged with the server. Smaller payloads lead to shorter network activity, reducing battery usage.
Database queries
Similarly to Network requests, when we utilize a local database for data caching or other purposes, we should be mindful of its usage. Database queries consume both CPU and battery and should be optimized with the same techniques as the network requests.
By implementing these optimization strategies, you can ensure that your app is more energy-efficient and less likely to experience lag during usage.
Conclusion
In the first blog post of the optimization series, we deep-dived into the CPU usage and battery optimization topics. We learned how to effectively use the Android studio profiler to identify potential performance issues as well as optimization techniques to mitigate potential issues.
Remember to “profile often but optimize rarely and only when it’s truly required.
Stay tuned for the rest of the Android optimization series, where we will touch on the critical aspects of memory and UI optimization.