
4 posts tagged with "performance"

View All Tags

· 12 min read
Petros Efthymiou

Android Performance Optimization Series - UI Rendering

Introduction

Welcome to the third and final article of the Android Performance Optimization series! In the first article, we explored the fundamentals of performance optimization, focusing on CPU and battery. In the second article, we deep-dived into the crucial topic of RAM memory optimization and memory leaks. Now, it’s time to focus on UI optimization and rendering efficiency.

Traditionally, Android used the XML-based way to build UIs; in recent years Google followed the trend of declarative UI creation and released Jetpack Compose. Even though new projects tend to follow the Jetpack Compose approach there is still an extensive amount of Android apps that are based on the XML approach. Therefore, in this article we will include optimization techniques for both.

We will start with techniques that are applicable to both approaches, then we will continue with the XML, and finally, we will focus on optimizing Jetpack Compose UIs.

By implementing the practical techniques presented here, you can ensure your app delivers a smooth, responsive user experience.

Common techniques

Avoid UI Overdraw

Overdraw happens when the same pixel on the screen is drawn multiple times. This is common with overlapping UI elements. While the system needs to render elements in a specific order for transparency effects, excessive overdraw wastes GPU power and may cause a slow rendering time and responsiveness.

With XML, we can introduce UI overdraw when using FrameLayout and with Jetpack Compose when adding views on a Surface on top of each other.

To identify and fix overdraw, enable developer options and use the overdraw visualization tool. This will highlight areas where pixels are being drawn unnecessarily, allowing you to optimize your UI layout and element usage for better performance.

In order to enable the overdraw visualization tool, open up your device or emulator and navigate to the developer options. Enable the option Debug GPU overdraw.

Debug GPU overdraw

Now, you can run your application, and you will notice all the overdraw areas based on the color code. For example, in the screenshot below, the app bar is drawn on top of the screen, and we can see there is an overdraw. The same is happening with the app bar options.

app bar options

Furthermore, if we drag the pull-to-refresh component, we will see the emulator indicating an overdrawn element.

alt_text

Obviously, you can't avoid all overdraw cases, some, like this one, exist by design. But you can identify and fix the unintended ones.

Use animations sparingly

Animations are resource intensive. And while they can add polish to your app, it's crucial to use them sparingly. Excessive animations can overwhelm users and strain system resources. Think of them as sprinkles on a cupcake - a little adds delight, but too much can overpower the taste. Use animations strategically to highlight key actions or guide users through a process, but prioritize clarity and performance over constant movement.

Avoid processing in the UI thread.

This is probably the most important technique for building a responsive application and avoiding ANRs. An ANR (Application not responsive) occurs when you keep the Main thread busy for too long. In those cases, the OS prompts the user to kill the application. This is the worst possible UX other than an application crash.

Heavy data processing, as well as tasks like HTTP requests and database queries, must always happen on background threads. There are several techniques for performing those tasks in background threads, like using background services, async tasks, and more modern techniques like Reactive Programming or Kotlin Coroutines.

Regardless of which one you choose to perform your background work, the important thing is to avoid doing it in the Main thread.

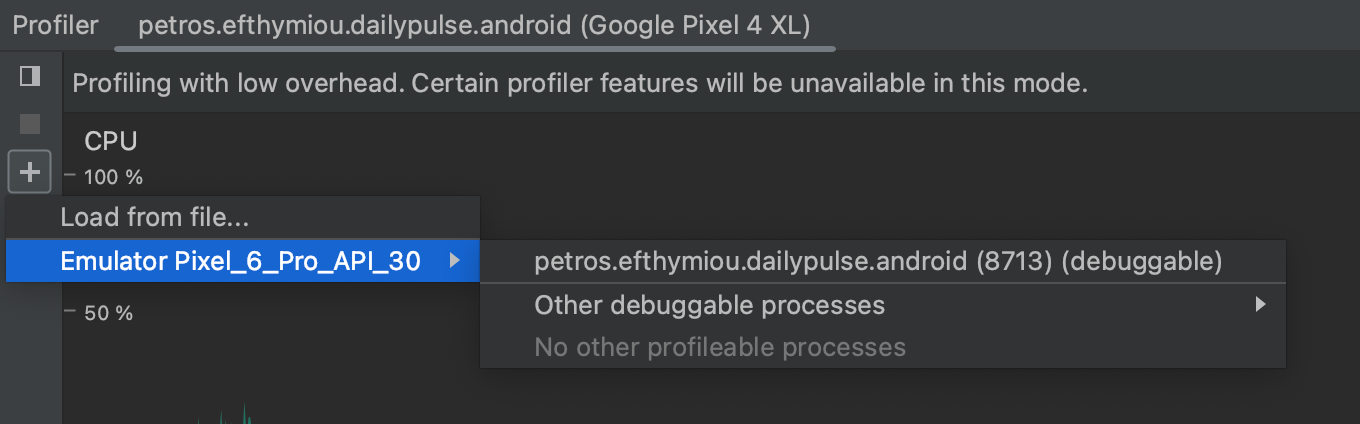
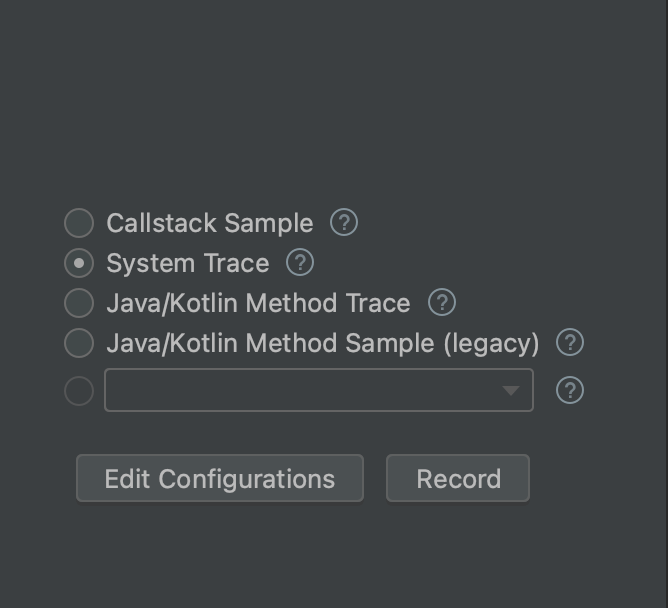
Profile the Hardware UI rendering.

Unlike the GPU, RAM and battery consumption, we cannot monitor the UI performance from Android Studio. Instead we need to go to the developer options of our device or emulator and enable the Profile HWUI Rendering option.

alt_text

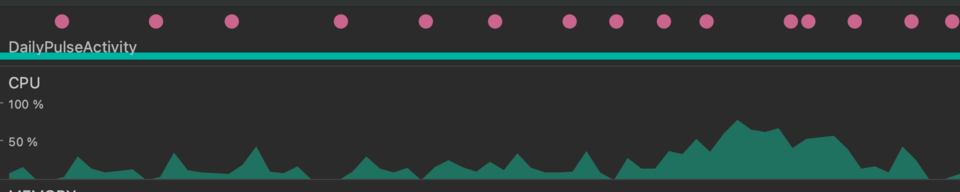
Here I prefer to use the option On screen as bars. Once you click on this option, you will start seeing a bar chart on your screen that looks like this:

alt_text

You can interpret the bar chart as follows:

  • For each visible application, the tool displays a graph.
  • Each vertical bar along the horizontal axis represents a frame, and the height of each vertical bar represents the amount of time the frame took to render (in milliseconds).
  • The horizontal green line represents 16.67 milliseconds. To achieve 60 frames per second which assures an optimal UX, the vertical bar for each frame needs to stay below this line. Any time a bar surpasses this line, there may be pauses in the animations.
  • The tool highlights frames that exceed the 16.67 millisecond threshold by making the corresponding bar wider and less transparent.
  • Each bar has colored components that map to a stage in the rendering pipeline. The number of components vary depending on the API level of the device.
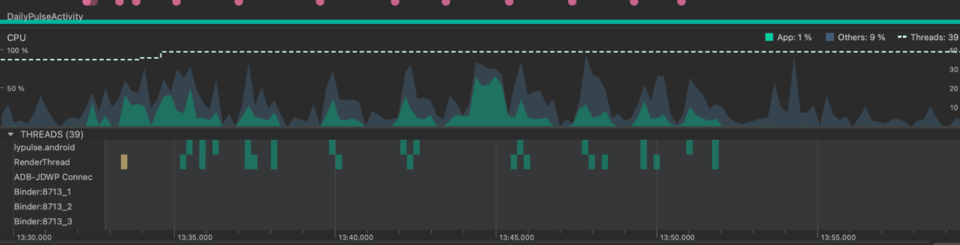
For example:

alt_text

In this application, the first line, the longest one, represents the application startup. The second big line in the middle occurred when I navigated from one screen to another and this caused a rendering overload.

Using this tool, you can identify the most GPU resource-heavy screens and transitions and start focusing on optimizing those.

For more info regarding the HWUI profiling, you can visit the official documentation here: https://developer.android.com/topic/performance/rendering/inspect-gpu-rendering

XML UI Optimization

Now, let’s focus on a few techniques that will help you optimize the XML-based Android UIs.

Flatten View Hierarchy

A deep view hierarchy with lots of nested layouts can lead to performance issues in your Android app. A complex hierarchy forces the system to measure and layout views in a nested fashion. Flattening the hierarchy reduces these nested calculations, leading to faster rendering and smoother UI updates.

Furthermore, a simpler view hierarchy is easier to understand and debug. This saves development time and makes it easier to identify and fix layout issues.

ConstraintLayout excels at creating complex UIs with a flat view hierarchy. Unlike layouts like RelativeLayout, which rely on nested ViewGroups, ConstraintLayout allows you to position views directly relative to each other or the parent layout using constraints. This eliminates unnecessary nesting, resulting in a simpler and more efficient layout structure. The reduced complexity translates to faster rendering times and a smoother user experience, especially on devices with less powerful hardware. Additionally, ConstraintLayout's visual editor in Android Studio makes it intuitive to define these relationships between views, streamlining the UI development process.

For more information about Constraint Layout you can check the following article: https://blog.shipbook.io/constraintlayout

Make use of the View Stub

Not all sections of your UI are needed right away. Imagine a comment section that only appears when a user taps a "show comments" button. Most apps are implementing this using the View visibility attribute.

There's actually a more performant option called ViewStub. It acts as a placeholder in your layout, taking up zero space. When needed, you can inflate a complex layout (like the comment section) into the ViewStub's place. This keeps your initial UI load faster and smoother, and only inflates resource-intensive views when absolutely necessary. This improves both performance and memory usage in your Android app.

    <ViewStub android:id="@+id/stub"
android:inflatedId="@+id/subTree"
android:layout="@layout/mySubTree"
android:layout_width="120dip"
android:layout_height="40dip" />

Of course, not every element that changes visibility during its lifecycle needs to be a View Stub. View stubs currently don’t support the merge tag, and can’t be used more than once. This element is best used on Views that may not appear at all. Some examples can be error messages or advertising banner campaigns.

Recycler View and View Holder Pattern

Using the RecyclerView with the ViewHolder pattern is crucial for efficient and optimized handling of large datasets in Android applications. The ViewHolder pattern enhances performance by recycling and reusing existing views, thus minimizing the overhead of creating new view instances. This approach significantly reduces memory usage and improves scrolling performance, especially when dealing with long lists or grids. By binding data to reusable ViewHolder objects, RecyclerView ensures smooth and responsive UI interactions while dynamically adapting to changes in dataset size. Ultimately, implementing the RecyclerView with the ViewHolder pattern is not just a best practice but a fundamental strategy for delivering high-performance and scalable user interfaces in Android apps.

For more info on this subject, you can refer to the following article: https://blog.shipbook.io/recyclerview-vs-listview

Jetpack Compose Optimization

Now, let’s move our focus to Jetpack Compose. Compose is inherently built to be more performant than XML. Basically, that’s one of the reasons for the declarative UI paradigm shift in all platforms. When a screen element changes, they avoid redrawing the whole screen. They try to keep everything as is, and they only redraw the changed element.

Notice the keyword there — “try”. Compose will trigger recomposition when snapshot state changes and skip any composables that haven’t changed. Importantly though, a composable will only be skipped if Compose can be sure that none of the parameters of a composable have been updated. Otherwise, if Compose can’t be sure, it will always be recomposed when its parent composable is recomposed. If Compose didn’t do this, it would be very hard to diagnose bugs with recomposition not triggering. It is much better to be correct and slightly less performant than incorrect but slightly faster.

You can see how many times a View has been redrawn on the screen using the layout inspector:

alt_text

This way, you can identify which Views keep getting redrawn and may potentially be optimized, as we will show below.

Skippable UI Elements

The compose compiler is trying during compile time to identify which Composable elements are skippable. Meaning that if their own data hasn't changed, they don't need to get redrawn on the screen. It’s clear that the more skippable components you have on your screens, the more performant your UI is going to be as it avoids redrawing unchanged elements.

So the question is, how can you make your Composables skippable? The answer is simple: Immutability!

Is the following Composable skippable?

@Composable
private fun PlaylistRow(
playlist: Playlist
) {
Column(Modifier.padding(8.dp)) {
Text(
text = playlist.name,
style = MaterialTheme.typography.bodySmall,
color = Color.Gray,
)
Text(
text = playlist.length.toString(),
style = MaterialTheme.typography.bodyLarge,
)
}
}

The answer is we can’t tell unless we study the Playlist model.

With the following playlist model, is our Composable skippable? What do you think?

data class Playlist(
val id: String,
val name: String,
var length: Int
)

The answer is no. Because the length is a mutable variable that might have changed without Jetpack Compose knowing.

We can make our PlaylistRow skippable by making length an immutable value by changing var -> val.

data class Playlist(
val id: String,
val name: String,
val length: Int
)

Now if we change our Playlist model as below, will our Playlist row still be skippable or not?

data class Playlist(
val id: String,
val name: String,
val length: Int,
val songs: List<Song>
)

data class Song(
val id: String,
val name: String
)

The answer is not because Kotlin List is mutable. It is compile-time read-only but not immutable. The underlying data can still be changed and Compose compiler is not going to take any risks.

Use a kotlinx immutable collection instead of List

data class Playlist(
val id: String,
val name: String,
val length: Int,
val songs: ImmutableList<Song>
)

Version 1.2 of the Compose compiler includes support for Kotlinx Immutable Collections. These collections are guaranteed to be immutable and will be inferred as such by the compiler. This library is still in alpha, though, so expect possible changes to its API. You should evaluate if this is acceptable for your project.

Finally, you can also decide to annotate your model with the @stable annotation if you are certain that it is skippable. But this can be dangerous. This way you are instructing the Compose compiler that even though a model might be unstable, I want you to treat it as stable and the respective Composables that use it as skippable.

It’s dangerous because the values of the object may have been changed, but Compose may not have noticed it and still be showing the old values, leading to sketchy bugs. Annotating a class overrides what the compiler inferred about your class. In this way, it is similar to the !! operator in Kotlin.

For debugging the stability of your composables you can run the following task:

./gradlew assembleRelease -PcomposeCompilerReports=true

Open up the composables.txt file and you will see all of your composable functions for that module and each will be marked with whether they are skippable and the stability of their parameters.

restartable scheme("[androidx.compose.ui.UiComposable]") fun DisplayPlaylists(
stable index: Int
unstable playlists: List<Playlist>
stable onPlaylistClick: Function1<Long, Unit>
stable modifier: Modifier? = @static Companion
)

Lazy Column

Similar to what we saw in the XML approach, Compose also has a mechanism to optimize large lists and that’s the Lazy Column component. Lazy Column is optimized to display large datasets in a list as it avoids unnecessary pre-calculations. We have a wonderful article here that explains the differences between Column and Lazy Column in this link

Conclusion

In this series of articles, we analyzed how you can profile your app in order to identify performance issues with

  1. Battery
  2. CPU
  3. RAM memory
  4. UI rendering

We also explained optimization techniques that you can include in your toolset in order to resolve those issues.

What I would like you to keep from this series is that you should be profiling much more than optimizing. Premature optimization will slow down your team and product without providing much value.

Profile often, optimize when necessary.

· 10 min read
Petros Efthymiou

Android Performance Optimization Series - Memory RAM

Introduction

In our previous article, we explored the fundamentals of Android performance optimization, focusing on CPU and battery. This second article delves deeper into the crucial aspect of RAM optimization, examining strategies for profiling and managing memory usage effectively to enhance your app's performance and user experience.

By implementing the practical techniques presented here, you can ensure your app utilizes system resources efficiently, delivering a smooth, responsive experience for your users.

RAM (Random Access Memory) is the primary memory of an Android device, acting as a temporary workspace for storing data actively used by applications.

Why RAM Optimization Matters

RAM optimization is essential for several reasons:

  1. Improved Performance:

    RAM is the primary workspace for active app data, and efficient RAM management ensures that your app doesn't consume excessive resources. This leads to several benefits:

    • Increase responsiveness and avoid ANRs. If the device runs out of memory, the application may become unresponsive. The app will appear as “stacked”. The OS, at that point, may choose to free some memory forcefully, but the UX is already jeopardized.
    • Reduced Scrolling Lag: Efficient RAM usage prevents bottlenecks that can cause scrolling to become sluggish or unresponsive, enhancing the overall user experience.
    • Smoother Animations and User Interface: RAM optimization allows your app to render animations and transitions smoothly, ensuring a responsive and engaging user experience.
  2. Reduced Crashes:

    Memory leaks occur when unused memory remains allocated, leading to performance degradation and potential crashes.

    Memory leaks occur when unused memory remains allocated, leading to performance degradation and potential crashes. By Memory leaks, we mean objects that are unused by the app, but the JVM garbage collector cannot release them because we have forgotten a reference to them somewhere in our code.

    Examples of this can be firing a coroutine to fetch information for a screen but not using the ViewModel scope. Then, if you navigate away from that screen and it gets destroyed, the coroutine will not be destroyed as it’s not tied to the lifecycle of that screen’s ViewModel.

    By implementing proper memory management practices, you can prevent these leaks and maintain system stability.

  3. Extended Battery Life:

    When apps consume excessive RAM, the system needs to constantly reload data from storage, which can drain the battery. RAM optimization helps conserve battery life:

    • Reduced Memory Thrashing: Efficient memory management minimizes the need for frequent garbage collection, which can impact battery performance.
    • Lower Background Activity: By using resources efficiently, your app reduces the need for background activities that consume battery power. By Background Activity, we refer to any kind of asynchronous data retrieval or processing that is not directly related to the current user action.
    • Optimized Data Storage: Use data compression and caching techniques to reduce the amount of data stored in RAM, minimizing battery consumption.

    By prioritizing RAM optimization, you can create a high-performing app that not only delivers a smooth user experience but also extends battery life and contributes to a more efficient overall system experience for your users.

Memory Profiling: Unveiling Memory Usage Patterns

Effective RAM optimization requires a deep understanding of how your app utilizes memory. Memory profiling tools provide valuable insights into memory usage patterns, enabling you to identify potential bottlenecks and optimize memory allocation.

Android Studio's built-in Memory Profiler is a powerful tool for analyzing your app's memory footprint. It allows you to monitor memory usage over time, identify memory allocation spikes, and track the lifecycle of objects. By analyzing heap dumps, you can pinpoint memory leaks and understand which objects are consuming excessive memory.

How to profile memory usage in Android

Realtime Memory Tracking

Monitor the app's memory usage in real time to identify spikes and trends. In order to profile RAM memory usage in Android, you need to open your project in Android Studio. In the search bar, search for “profiler” and click on the respective option.

profiler

Now, the Android profiler has been attached to your running application. You can see it at the bottom view of Android Studio. The initial view is capturing the CPU (top) and the memory (bottom) usage.

cpu and memory

You can see the CPU and MEMORY usage based on time (bottom) that is consumed by each Activity. In our case, as you can see, we first opened a LoginActivity that consumed certain resources, and then, after the login at 00:47, we switched to the MainActivity. We had a spike in CPU usage at the moment of transition, but the RAM usage remained stable. Also, as you can see, the current state of the LoginActivity is stopped - saved while the MainActivity is active.

For more on CPU usage, you can refer to the previous article in the series. Since this article focuses on RAM, let’s switch to the dedicated memory view and get the CPU out of the tracked metrics. In order to do this, click on System Trace

system trace

And on the top right, click on the “MEMORY” tab.

memory

Now you can see a detailed view of the memory consumption per category:

memory detail

Again, you can track the transition of the Activities on the top, but now we get a more detailed RAM graphic that indicates where the RAM is being used. We get the total memory consumption, which is 152 MB, and then we can see that:

  • Java and JVM are consuming 19,2 MB
  • Native 34,6 MB. This refers to C / C ++ objects.
  • Android Graphics 0
  • The stack 1,1 MB
  • The code execution 66,3 MB
  • And others 30,7MB

Two more helpful things to note:

  1. if you look at the top, you can see some pink dots. These represent the user clicks in the application. The prolonged ones refer to extended clicks or scrolling through a list. In my case, I was scrolling through a list, that’s why you can notice there are some spikes in memory usage at those time frames. Scrolling through extensive lists is memory-consuming.
  2. The screen line at the top that represents the activity lifecycle contains some gray spots. Those represent the switching between different fragments. Depending on how much memory each Fragment consumes, you may notice memory spikes at those time frames as well.

Heap Dump Analysis

Besides real-time memory profiling, you can capture heap dumps at different points in the app's lifecycle to analyze the allocation and retention of objects. Identify objects that remain allocated even when no longer needed, indicating potential memory leaks.

In order to do this, you can select the “Capture heap dump” option and click “Record”.

This will capture the current snapshot of the heap and all the active objects that consume memory. What normally helps me navigate through the memory dump is to click “Arrange by package” and then expand on the package name of my application in order to see which of the objects I control consumes the most memory.

heap dump

In this view, you can see how much memory each package is using per memory category, and if you expand on the packages, you will see the detailed memory consumption per object. You can play a bit around with this tool in order to find the view that best suits you to understand where your memory is consumed.

The Heap Dump, as we explained, is a snapshot of the app that contains all the information about how the memory is currently consumed. You also have the option to record the usage of either native(C/C++) or Java/Kotlin allocations over time by using the options below.

allocation options

Personally, I use the real-time memory tracking to get an idea about how my apps consume memory over time or the Heap Dump when I need very detailed information about the current memory usage per package and class.

Leak Canary

Another helpful tool to capture memory leaks in the Android app is the library Leak Canary.

Leak Canary is a useful library to detect such memory leaks. We can very easily integrate it by adding the respective dependency to our app’s build.gradle.

dependencies {
// debugImplementation because LeakCanary should only run in debug builds.
debugImplementation 'com.squareup.leakcanary:leakcanary-android:3.0-alpha-1'
}

No further code is needed, now, when the library detects a memory leak, it will pop a notification and capture a heap dump to help us detect what the memory leak is and what caused it.

Leak Canary

I strongly recommend using Leak Canary in your app.

Memory Optimization Techniques

Effective RAM optimization involves a combination of measures and strategies.

  1. Avoid memory leaks with Coroutines structured concurrency. In the previous section, we explained how to detect memory leaks. Let’s not see how to avoid them. Most memory leaks are caused by background work that is no longer required but still referenced. The most effective way to prevent this is by using the Coroutines structure concurrency.
    Make sure to replace all the background work mechanisms, such as Async Task, RX Kotlin, etc, with coroutines and tie the work to the adequate coroutine scope. When the work is related to a screen, tie it to its View Mode’s lifecycle by using the View Model scope. This way, the work will be canceled when the View Model is destroyed. Avoid using global scope, and if you do, make sure you cancel it when it’s no longer needed.

  2. Build efficient lazy loading lists with Jetpack Compose lazy column or view holder pattern. Extensive lists consume a lot of memory, especially if you load all the items at once. Currently, the most memory-efficient list mechanism is the Jetpack Compose Lazy Column; for more info, please refer to our respective article. The second most efficient way is the recycler view combined with the view holder pattern. The lazy loading technique can be extended to more objects besides lists.

  3. Minimize Unused Resources: Carefully manage the resources your app consumes, particularly images and background services. Use appropriate image formats, such as WebP or PNG, and optimize image dimensions to reduce file size.

  4. Optimize Animation Usage: Animations can be resource-intensive. Use animations sparingly and optimize them for efficiency to minimize memory usage.

  5. Utilize Dependency Injection Frameworks: Dependency injection frameworks like Hilt or Dagger 2 can help manage and reuse objects efficiently, reducing memory usage. Those frameworks using the scope mechanism provide an easy way to allow only a single instance of an object. By allowing only a single object instance, we avoid loading the memory with unnecessary objects.

    Finally, you should be Mindful of External Libraries: Carefully select and use external libraries. Some libraries may introduce unnecessary resource overhead.

By implementing these memory optimization techniques, you can ensure your Android app consistently delivers a smooth, responsive user experience while utilizing system resources efficiently.

Conclusion

In the second, we dived deep into RAM optimization. We first saw how to profile memory usage and detect memory leaks, and then we discussed optimization techniques.

Effective RAM optimization is a crucial aspect of developing high-performing Android apps. By implementing the strategies discussed in this article, you can significantly enhance your app's memory management, reducing memory leaks, improving performance, and extending battery life. Shipbook’s remote logging capabilities are also a helpful tool to track down issues.

Remember, continuous monitoring and optimization are essential for maintaining a top-notch user experience.

· 11 min read
Petros Efthymiou

Android Performance Optimization Series- Battery &amp; CPU

Introduction

In the dynamic world of Android app development, performance is crucial in order to meet the growing user expectations. Users demand smooth, responsive, and battery-efficient experiences, and they won't hesitate to uninstall apps that fall short. As developers, it's our responsibility to ensure our Android applications are not just functional but also performant.

We will be posting an exclusive series of articles where we go deep into the realm of Android performance profiling and optimization! Over the next few blog posts, we'll embark on an enlightening journey to demystify the Android apps’ performance. In this comprehensive series, we'll touch on the critical aspects of CPU usage, battery consumption, memory management, and UI optimization. Whether you're a seasoned developer seeking to fine-tune your app or a newcomer eager to master the art of Android optimization, this series is your roadmap to achieving peak performance. Get ready to unleash the full potential of your Android applications! 🚀

The Importance of Performance Optimization

Performance optimization isn't merely a luxury; it's a necessity. Beyond satisfying your users, there are several reasons to prioritize performance optimization in Android app development:

  1. User Retention: Performance issues, such as laggy UIs and slow load times, frustrate users and lead to high uninstall rates. An optimized app is more likely to retain and engage its user base.
  2. Market Competition: The landscape of mobile applications is crowded, and competition is fierce. An app that outperforms its peers has a clear advantage, which often translates to better ratings and more downloads.
  3. Battery Efficiency: Mobile device batteries are finite resources. An inefficient app can quickly drain a user's battery, leading to negative reviews and uninstalls. Optimal performance can significantly extend battery life.
  4. Resource Utilization: Efficient apps consume fewer system resources, such as CPU and memory. This, in turn, benefits the entire ecosystem by reducing strain on the device and enhancing the user experience across all apps.

In this article, we will explore battery consumption and CPU usage profiling and optimization. These two aspects are closely related. High CPU usage also leads to high battery consumption.

Understanding CPU Usage and Battery Consumption

Let’s first make sure we are on the same page regarding what we mean by the terms CPU Usage and Battery Consumption.

CPU Usage

The Central Processing Unit (CPU) is the brain of any computing device, including smartphones. CPU usage in the context of Android app performance refers to the percentage of the CPU's processing power that your app consumes. High CPU usage can lead to sluggish performance, increased power consumption, and a less responsive user interface. This happens as the CPU is unable to calculate everything which results to slow response times.

Monitoring CPU usage is crucial for several reasons:

  • Responsiveness: High CPU usage can cause your app to become unresponsive. Monitoring CPU usage allows you to identify performance bottlenecks and optimize your code for a smoother user experience.
  • Battery Life: As we already explained, excessive CPU usage can quickly drain a device's battery. By reducing CPU load, you can extend the device's battery life, leading to happier users.

Battery Consumption

Battery consumption is a key concern for mobile users. Apps that consume excessive battery are likely to be uninstalled or used sparingly. Why tracking battery consumption is essential:

  • User Retention: Excessive battery consumption is a major annoyance for users. By reducing your app's power consumption, you increase the likelihood of user retention.

I personally tend to uninstall apps that are very battery-demanding.

Profiling Battery Consumption and CPU usage

The skill to identify performance issues is arguably more important than the skill to optimize. In the same way, the read code to write code ratio is estimated to be about 10 to 1, we should spend more time identifying performance issues rather than performance optimizing. At first, this sounds weird, but it actually makes a lot of sense. Nowadays, even mobile devices have become quite powerful and are able to handle effectively heavy-duty tasks. Furthermore, performance optimization often leads to code that is harder to read and reason about. Therefore, we shouldn’t spend time optimizing code that has little to no effect on the actual real-time performance our users have. We must, though, always keep an eye on whether we have serious performance holes that we are not aware of. The Android Profiler is an excellent tool to do that!

Android Profiler

In order to start profiling an app, we first need to run the application from Android Studio in an emulator or a real device. When you have the app running, click the “Profiler” tab at the bottom of Android Studio:

profiler

Then, you need to locate the device on which you are running your app and click the “plus” icon to start a new profiler session. Find your app (debuggable process) and click on it.

debuggable process

Monitoring CPU Usage and Battery Consumption

Once you select your application, you are going to see something like the screenshot below. The top section indicates the percentage of CPU usage, and the bottom section the memory that our application is using.

cpu and memory

We are going to ignore the memory section for now as this article is focusing on CPU and battery. If we start using our app and navigate from screen to screen, we will notice that the CPU usage is increasing. Particularly when scrolling an extensive list that uses pagination, we can notice that the CPU usage is well getting above 50%. This happens because of the multiple network requests to fetch the next items as well as the lazy calculation of the UI items.

The pink dots at the top indicate the clicks we are doing inside the app.

clicks

Now, please click on the System Trace Link. The system trace initially has 2 tabs, one for the CPU and one for memory. Please click on CPU, and you will be able to track the CPU usage in even greater detail.

detailed cpu and memory

The green color indicates the CPU usage by our application, while the gray color the CPU by external factors such as the OS or other apps that may run in the background. We can also see the amount of threads that are currently active.

In order to track the battery usage, select on the left of the screen the system trace option and start recording.

recording

You can now use your app and perform the actions that you are interested in profiling, like navigating inside the app or scrolling a list. Once you are done, click stop recording, and you will get a full profiling report. On the top of the screen, you can see the CPU and, at the bottom, the energy profiler with the battery consumption.

full profiling report

The “Capacity” represents the remaining battery percentage (%).

The Charge the remaining battery charge in microampere-hours (µAh).

The Current is the instantaneous current in microampere (μΑ)

I personally though prefer to focus on CPU usage, which I find more helpful and straightforward. Generally, as a rule of thumb, high CPU usage means high battery consumption.

Besides CPU, though, there are other factors that contribute to battery consumption, such as GPU usage, Sensor core GPS or camera usage, etc. Unfortunately, in most devices, we are unable to get the detailed report as they don’t support the “On Device Power Rails Monitor” (ODPM). A few devices, such as Pixel 6 or Pixel 7, do support it, and the energy profiler there can give us the full battery usage report to understand further where we consume battery.

On Device Power Rails Monitor

Another great way to understand if your application is consuming too much battery is to simply use it as a user and check the system settings report that indicates your app’s battery consumption over time.

We now clearly understand how to profile our app’s CPU usage and battery consumption, either during runtime or by recording and storing usage reports. Let’s move on to the next section, where we will learn certain optimization techniques.

Optimization

The general rule to optimize both CPU usage and battery consumption is to avoid any unnecessary work. When we optimize CPU usage, we also optimize battery consumption and vice-versa. The difference is that in terms of CPU usage, we must avoid “doing all the work at once” which will overload it and cause performance issues, while battery consumption is about how much work we do over time.

Below, we will present certain areas that can overload the CPU and cause high battery drainage.

Precalculations

We often precalculate information, anticipating that we will need to display it later. We do it so that the information is available to the user instantly, and the user doesn’t have to wait for it. In many of the cases, though, the user will never navigate to the anticipated area, and the information won’t be displayed. Resulting in wasted CPU consumption and battery drainage.

  • Try to avoid prefetching data with multiple network requests at the application startup unless it’s really necessary. This can both overload your CPU, resulting at sluggish application startup, as well as unnecessarily drain the battery.
  • Avoid precalculating list elements. Use either the recycler view combined with the view holder pattern or the Jetpack Compose lazy column. Those components are performance-optimized and only create the items when the user is about to see them. API pagination is also a great technique to avoid prefetching an extensive amount of data.

Background Services

Background services are essential for tasks that need to run continuously or periodically, even when your app is not in the foreground. However, they can also be significant contributors to CPU usage and battery drain.

Optimization Strategies:

  • Scheduled Alarms: Utilize the AlarmManager to schedule tasks at specific intervals rather than running them continuously. This allows your app to minimize background processing time and conserve battery.
  • WorkManager: For periodic and deferrable tasks, use WorkManager. It efficiently manages background work, respecting device battery optimization features and network constraints.

Wake Locks

A wake lock allows your app to keep the device awake, which can significantly impact battery life if used excessively.

Optimization Strategies:

  • Use Wake Locks Sparingly: Only use wake locks when necessary, and release them as soon as the task is completed. Prolonged use of wake locks can prevent the device from entering low-power modes.
  • AlarmManager: In scenarios where you need to wake the device periodically, consider using the AlarmManager to schedule tasks instead of a continuous wake lock.
  • JobScheduler or WorkManager: These tools can be used to schedule tasks efficiently without the need for a persistent wake lock.

Location-Based Services

Location-based services, such as GPS and network-based location tracking, can have a significant impact on CPU usage and battery consumption, especially if they're continuously running.

Optimization Strategies:

  • Location Updates: Request location updates at longer intervals or adaptive intervals based on the user's current location. High-frequency updates consume more battery.
  • Geofencing: Utilize geofencing to trigger location-based actions when the user enters or exits defined areas. Geofencing is more efficient than continuous location tracking.
  • Fused Location Provider: Use the Fused Location Provider, which combines data from various sources and optimizes location requests. It reduces the need for the GPS chip, which consumes more power.

Battery and CPU Efficient Network Requests

Network requests can impact the device resource’s usage.

Optimization Strategies:

  • Batch Requests: Minimize the number of network requests by batching multiple requests into one. This reduces the frequency of radio usage, which is a significant battery consumer.
  • Network Constraints: Use tools like WorkManager, which respect network constraints. Schedule network-related work when the device is on Wi-Fi or when it has an unmetered connection, reducing cellular data usage.
  • Background Sync: If your app needs periodic data synchronization, schedule these tasks at intervals that minimize battery impact.
  • Optimize Payload Size: Minimize the size of data payloads exchanged with the server. Smaller payloads lead to shorter network activity, reducing battery usage.

Database queries

Similarly to Network requests, when we utilize a local database for data caching or other purposes, we should be mindful of its usage. Database queries consume both CPU and battery and should be optimized with the same techniques as the network requests.

By implementing these optimization strategies, you can ensure that your app is more energy-efficient and less likely to experience lag during usage.

Conclusion

In the first blog post of the optimization series, we deep-dived into the CPU usage and battery optimization topics. We learned how to effectively use the Android studio profiler to identify potential performance issues as well as optimization techniques to mitigate potential issues.

Remember to “profile often but optimize rarely and only when it’s truly required.

Stay tuned for the rest of the Android optimization series, where we will touch on the critical aspects of memory and UI optimization.

· 9 min read
Nikita Lazarev-Zubov

Code Readability vs. Performance

Introduction

The debate over the readability versus the performance of code is nothing new. More than once, during a code review, I’ve witnessed emotional discussions about a particular piece not being readable enough. I would argue for making it more readable, while the author would in turn argue that this would make the code less performant.

Who’s right? What’s more important, readability or performance? And are they necessarily mutually exclusive? Let’s find out. But first, let’s start with these two fundamental questions: What does it mean for code to be readable and what does it mean for it to be performant?

What Is Readability?

Readable code is code that programmers can understand with ease. But why is this important? In the end, code is written for machines, no? But computers don’t read your code; they use machine code produced by compilers or interpreters from your source code. The main reader of your code is you. And you need it to be understandable in order to make it less error-prone and easier to debug.

Your colleagues also have to read your code. When development teams create or maintain software, they spend more time reading code than writing it. Your fellow programmers need to understand what is already written in order to extend it with new features and fix bugs: It’s not possible to fix code without knowing how it works.

How do you know if your code is readable? If your colleagues don’t spend the entire day trying to understand what you wrote and don’t ask you too many questions, you can rest assured your code is understandable. How can you achieve this? Code style helps a lot: meaningful variable names, consistent indentation, etc. Happily, we have linters and formatters, already included in IDEs or plugged-in, to help.

Another important thing is making code intuitive, and this is what takes experience. For instance, can you immediately get at what this Swift code does?:

    var result = maxColumnsCount
while result > 0 {
if width >= (minColumnWidth * result) {
return result
}
result -= 1
}


return 1

It’s code I once came across in a real project. Although it’s written using common code style, it took me a while to understand what exactly happens there.

This is another snippet that does exactly the same as the previous one but looks entirely different:

    max(min((width / minColumnWidth), maxColumnsCount), 1)

Again, there’ll likely be no complaints from linters, but I personally still find it very difficult to grasp.

What the above code does is calculate the number of table columns, having as input a maximum table width, a minimum column width, and a maximum number of columns. Here’s the final version that was used:

    let nominalColumnsCount = width / minColumnWidth
if (nominalColumnsCount == 0) {
return 1
}


return min(nominalColumnsCount, maxColumnsCount)

Readability Is Relative

Code readability depends a lot on the programming language, the ecosystem, and, of course, people. There’s no universal way of measuring readability because different development teams are used to different conventions. For example, in Swift, this is one way to count unique elements in an array, leaving only those that occur more than twice:

    array
.reduce(into: [:]) { $0[$1, default: 0] += 1 }
.filter { $0.value > 2 }

Some people consider this code perfectly readable, idiomatic, and clear. But others prefer another approach:

    var occurrences = [String : Int]()
for element in array {
occurrences[element, default: 0] += 1
}
for key in occurences.keys {
if (occurrences[key] ?? 0) < 3 {
occurences.removeValue(forKey: key)
}
}

So it’s not about picking the “right” style, but sticking to one style consistently.

What Is Performance?

Performance is also a notion that most people understand intuitively: It’s the ability for code to run efficiently and use fewer resources. The issue is that it’s not always clear what code is considered efficient.

As an example, consider a table view on a mobile device. The scrolling of table views looks smoothest when the device manages to render at least 60 frames per second. So, you wrote code for your table that you’re happy with and measured a scrolling frame rate on the least-powerful supported device. But now, you think you could make your code even faster. Is it worth the effort? The answer is usually no. Your code already meets requirements and, thus, is efficient enough. In this context, which code can you call performant? Technically, both, because they both meet requirements, but you should stop at your first attempt and don’t waste effort on further improvements.

This brings us to the point that there is no performant or non-performant code. There’s simply an acceptable level of performance, which makes performance also relative.

Readability vs. Performance

Let’s look at three ways of calculating the number of table columns, described above, one more time and put them into the table view context with its 60 fps.

I measured all three options on my device and found that the second one is the fastest. Does it mean we have a winner and should use it, compromising readability? Again, the answer is most probably no. The numbers I get roughly mean that the winning option must run about 1,800 times every second during the table scrolling in order to force my iPhone to skip a single frame. The performance gain is too insignificant to even consider it.

If the scrolling animation is laggy, there’s a good chance that something else is slowing it down. And from my experience, it’s not easy to guess exactly what that something is. For instance, one of the common reasons for unresponsiveness is networking calls, which can be easily moved to a background thread without affecting readability. Always profile your program before jumping to conclusions. Contemporary IDEs are rich in tools that help you find the piece of code slowing down your program.

Mindset Changed with Time

A long time ago, computers were very expensive, but their resources were very limited. That forced people to constantly make their programs faster. However, with time, hardware efficiency grew dramatically, and today we live in times of cheap RAM and powerful CPUs.

Gains in computational resources let us create bigger and more complicated programs. This required more readable programming languages to appear, the languages that aim to be closer to humans than machines.

At the same time, engineers haven’t become cheaper. So, next time you’re happy to gain a millisecond of performance time for a MacBook, also remember the hours spent on deriving a sophisticated algorithm and the time your colleagues will spend on understanding it.

Tools became smarter too. Compilers are able to perform tricky optimizations that often make poor and very apt code run at comparable speeds. Operating systems are also now smart enough to cache your data without your intervention.

All of these factors let us not think about code performance in the vast majority of cases. And if you think you should, start with profiling your program and then focus only on that specific piece of slow code that really needs optimization.

Is Performant Code Necessarily Unreadable?

If you organize your code nicely, I believe even heavily optimized code can still be perfectly readable.

Consider a classical example of multiplying an integer by two. You can use the straightforward approach by writing number * 2. Alternatively, you can use an operation of bit shifting, which is cheaper for CPUs: number &lt;< 1 (or number shl 1 in Kotlin). Given your compiler doesn’t perform this optimization automatically, the latter option might run twice as fast. It can save seconds of end-user time because multiplication by two is a relatively frequent operation. On the other hand, the shifting option can easily confuse other developers.

You can also wrap shifting with a function with a meaningful name, and the intent will stay clear. You can then mark the function as inlinable for the compiler and avoid the penalty for introducing a new method.

    inline fun doubleNumber(number: Int): Int = number shl 1

In more desperate situations, you can at least cover your sophisticated algorithms with comments, and it will be good enough in most cases.

Is Readable Code Unperformant?

Not necessarily. Writing clean, well-organized code will usually result in good-enough efficiency. That is the nature of today’s programming languages and compilers: They can read the intent from your source code and turn it into fast machine code.

Although sometimes you just need to walk that extra mile, e.g., choose wisely between reference and value types, restrict inheritance to avoid dynamic dispatch, plant the inline directive here and there, these measures don't make code less readable. In fact, they do the opposite: They make your source code more idiomatic and help explain why it is what it is.

Conclusion

When it comes to performance, the very first thing that comes to my mind is the renowned quote from Donald Knut: “We should forget about small efficiencies, say about 97% of the time: premature optimization is the root of all evil. Yet we should not pass up our opportunities in that critical 3%.”

You design and code first, then optimize only if needed. Performing optimizations on a good design is always easier, and good design usually helps produce more performant software. This is especially true over the long term: It’s harder to spoil the program during its maintenance and extension if it’s clean and readable.

Another way of expressing the moral of this article is to cite Kent Beck’s “Make it work, make it right, make it fast.” I would recommend thinking twice before trying to make your code fast. Perhaps, it’s already fast enough.


Shipbook gives you the power to remotely gather, search and analyze your user logs and crashes in the cloud, on a per-user & session basis.