Introduction
In our previous article, we explored the fundamentals of Android performance optimization, focusing on CPU and battery. This second article delves deeper into the crucial aspect of RAM optimization, examining strategies for profiling and managing memory usage effectively to enhance your app's performance and user experience.
By implementing the practical techniques presented here, you can ensure your app utilizes system resources efficiently, delivering a smooth, responsive experience for your users.
RAM (Random Access Memory) is the primary memory of an Android device, acting as a temporary workspace for storing data actively used by applications.
Why RAM Optimization Matters
RAM optimization is essential for several reasons:
-
Improved Performance:
RAM is the primary workspace for active app data, and efficient RAM management ensures that your app doesn't consume excessive resources. This leads to several benefits:
- Increase responsiveness and avoid ANRs. If the device runs out of memory, the application may become unresponsive. The app will appear as “stacked”. The OS, at that point, may choose to free some memory forcefully, but the UX is already jeopardized.
- Reduced Scrolling Lag: Efficient RAM usage prevents bottlenecks that can cause scrolling to become sluggish or unresponsive, enhancing the overall user experience.
- Smoother Animations and User Interface: RAM optimization allows your app to render animations and transitions smoothly, ensuring a responsive and engaging user experience.
-
Reduced Crashes:
Memory leaks occur when unused memory remains allocated, leading to performance degradation and potential crashes.
Memory leaks occur when unused memory remains allocated, leading to performance degradation and potential crashes. By Memory leaks, we mean objects that are unused by the app, but the JVM garbage collector cannot release them because we have forgotten a reference to them somewhere in our code.
Examples of this can be firing a coroutine to fetch information for a screen but not using the ViewModel scope. Then, if you navigate away from that screen and it gets destroyed, the coroutine will not be destroyed as it’s not tied to the lifecycle of that screen’s ViewModel.
By implementing proper memory management practices, you can prevent these leaks and maintain system stability.
-
Extended Battery Life:
When apps consume excessive RAM, the system needs to constantly reload data from storage, which can drain the battery. RAM optimization helps conserve battery life:
- Reduced Memory Thrashing: Efficient memory management minimizes the need for frequent garbage collection, which can impact battery performance.
- Lower Background Activity: By using resources efficiently, your app reduces the need for background activities that consume battery power. By Background Activity, we refer to any kind of asynchronous data retrieval or processing that is not directly related to the current user action.
- Optimized Data Storage: Use data compression and caching techniques to reduce the amount of data stored in RAM, minimizing battery consumption.
By prioritizing RAM optimization, you can create a high-performing app that not only delivers a smooth user experience but also extends battery life and contributes to a more efficient overall system experience for your users.
Memory Profiling: Unveiling Memory Usage Patterns
Effective RAM optimization requires a deep understanding of how your app utilizes memory. Memory profiling tools provide valuable insights into memory usage patterns, enabling you to identify potential bottlenecks and optimize memory allocation.
Android Studio's built-in Memory Profiler is a powerful tool for analyzing your app's memory footprint. It allows you to monitor memory usage over time, identify memory allocation spikes, and track the lifecycle of objects. By analyzing heap dumps, you can pinpoint memory leaks and understand which objects are consuming excessive memory.
How to profile memory usage in Android
Realtime Memory Tracking
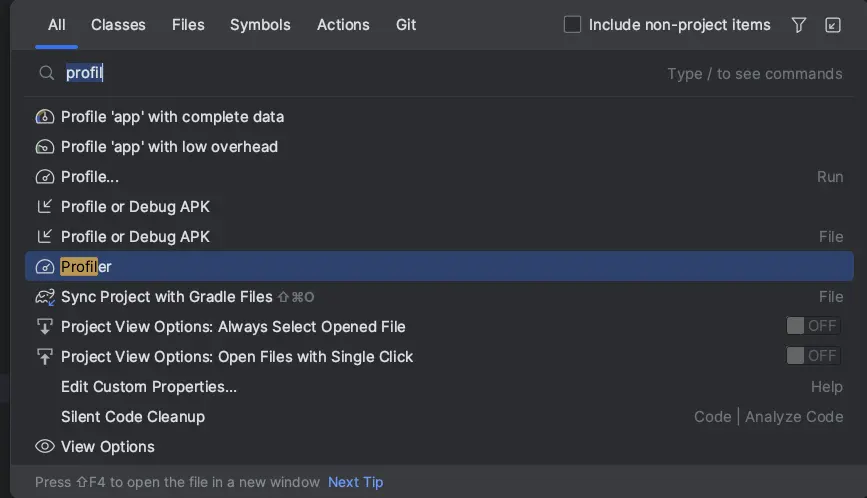
Monitor the app's memory usage in real time to identify spikes and trends. In order to profile RAM memory usage in Android, you need to open your project in Android Studio. In the search bar, search for “profiler” and click on the respective option.

Now, the Android profiler has been attached to your running application. You can see it at the bottom view of Android Studio. The initial view is capturing the CPU (top) and the memory (bottom) usage.
You can see the CPU and MEMORY usage based on time (bottom) that is consumed by each Activity. In our case, as you can see, we first opened a LoginActivity that consumed certain resources, and then, after the login at 00:47, we switched to the MainActivity. We had a spike in CPU usage at the moment of transition, but the RAM usage remained stable. Also, as you can see, the current state of the LoginActivity is stopped - saved while the MainActivity is active.
For more on CPU usage, you can refer to the previous article in the series. Since this article focuses on RAM, let’s switch to the dedicated memory view and get the CPU out of the tracked metrics. In order to do this, click on System Trace
And on the top right, click on the “MEMORY” tab.
Now you can see a detailed view of the memory consumption per category:

Again, you can track the transition of the Activities on the top, but now we get a more detailed RAM graphic that indicates where the RAM is being used. We get the total memory consumption, which is 152 MB, and then we can see that:
- Java and JVM are consuming 19,2 MB
- Native 34,6 MB. This refers to C / C ++ objects.
- Android Graphics 0
- The stack 1,1 MB
- The code execution 66,3 MB
- And others 30,7MB
Two more helpful things to note:
- if you look at the top, you can see some pink dots. These represent the user clicks in the application. The prolonged ones refer to extended clicks or scrolling through a list. In my case, I was scrolling through a list, that’s why you can notice there are some spikes in memory usage at those time frames. Scrolling through extensive lists is memory-consuming.
- The screen line at the top that represents the activity lifecycle contains some gray spots. Those represent the switching between different fragments. Depending on how much memory each Fragment consumes, you may notice memory spikes at those time frames as well.
Heap Dump Analysis
Besides real-time memory profiling, you can capture heap dumps at different points in the app's lifecycle to analyze the allocation and retention of objects. Identify objects that remain allocated even when no longer needed, indicating potential memory leaks.
In order to do this, you can select the “Capture heap dump” option and click “Record”.
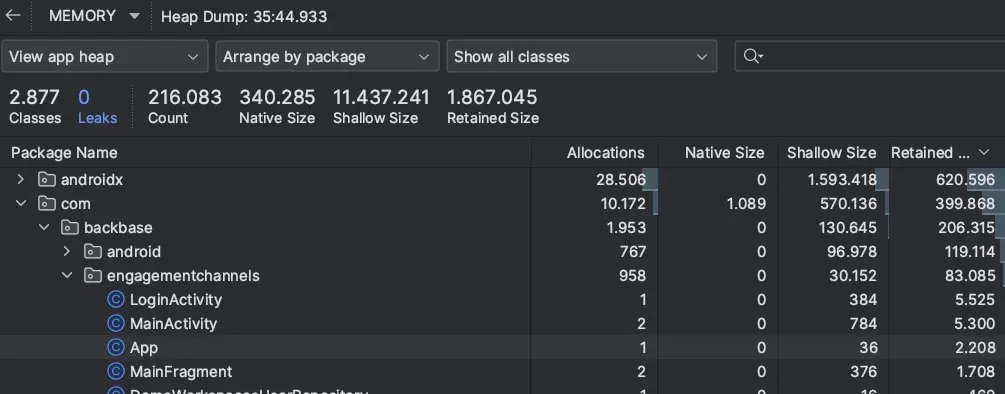
This will capture the current snapshot of the heap and all the active objects that consume memory. What normally helps me navigate through the memory dump is to click “Arrange by package” and then expand on the package name of my application in order to see which of the objects I control consumes the most memory.

In this view, you can see how much memory each package is using per memory category, and if you expand on the packages, you will see the detailed memory consumption per object. You can play a bit around with this tool in order to find the view that best suits you to understand where your memory is consumed.
The Heap Dump, as we explained, is a snapshot of the app that contains all the information about how the memory is currently consumed. You also have the option to record the usage of either native(C/C++) or Java/Kotlin allocations over time by using the options below.
Personally, I use the real-time memory tracking to get an idea about how my apps consume memory over time or the Heap Dump when I need very detailed information about the current memory usage per package and class.
Leak Canary
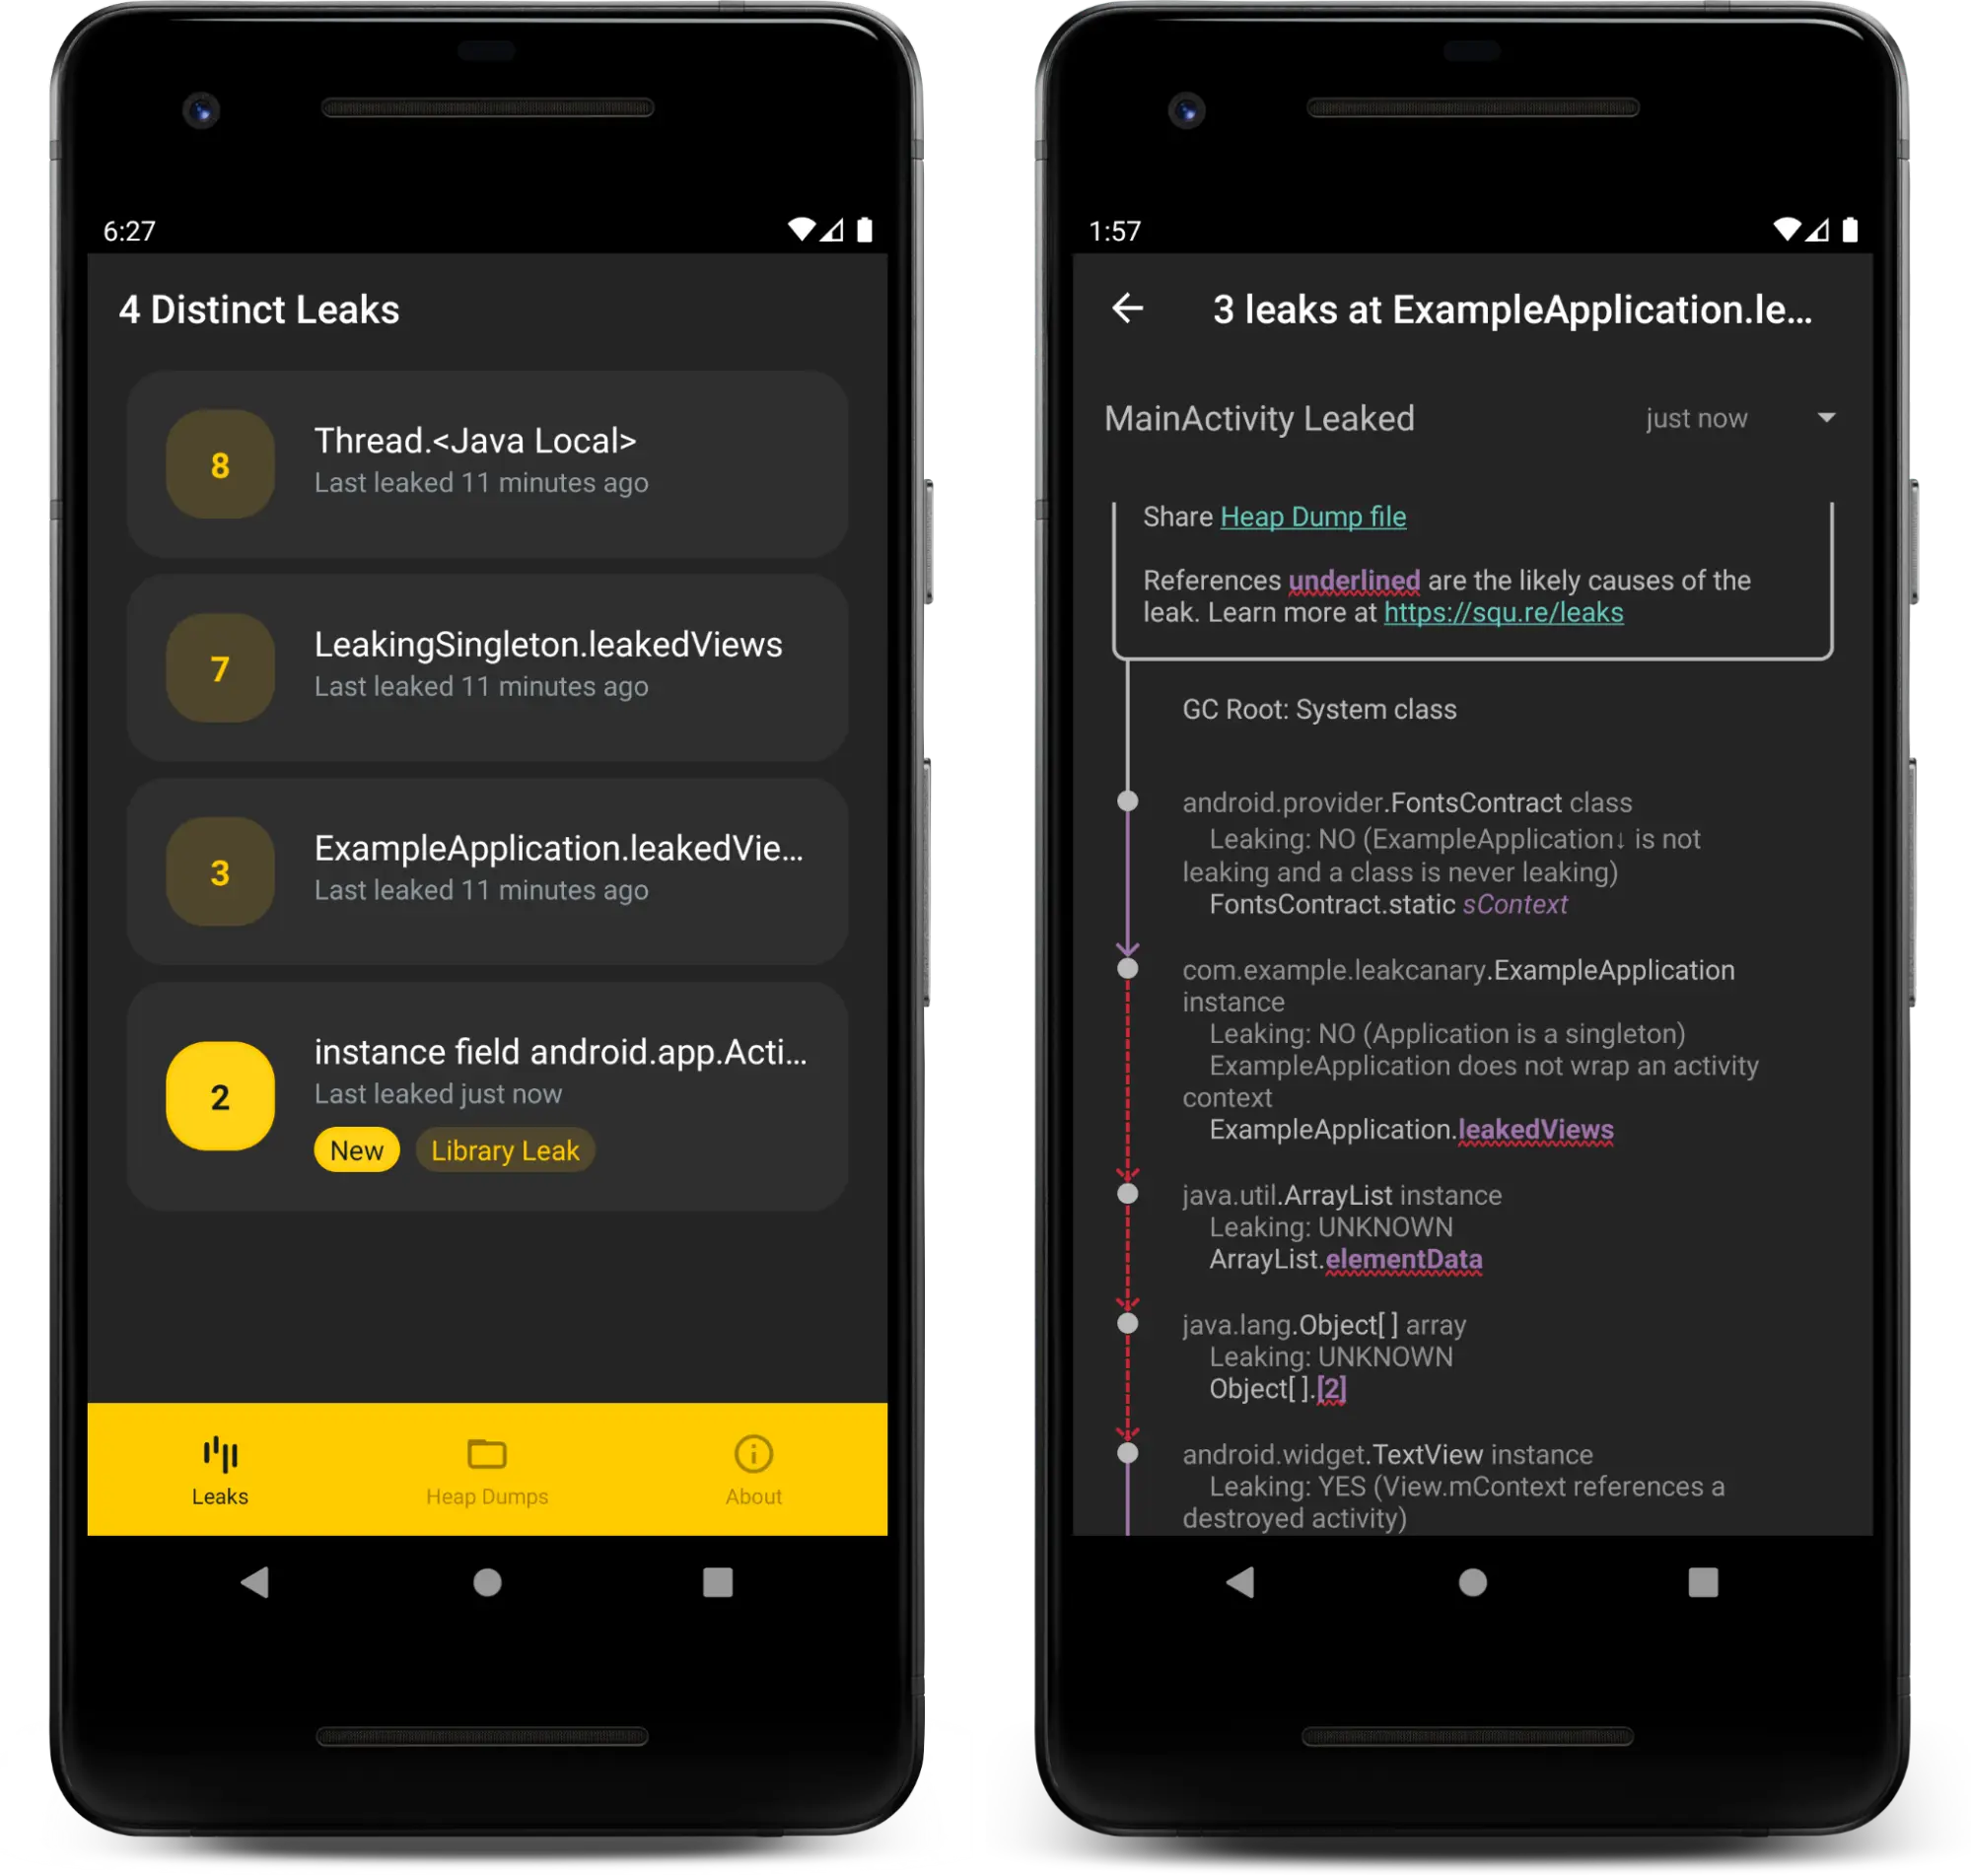
Another helpful tool to capture memory leaks in the Android app is the library Leak Canary.
Leak Canary is a useful library to detect such memory leaks. We can very easily integrate it by adding the respective dependency to our app’s build.gradle.
dependencies {
  // debugImplementation because LeakCanary should only run in debug builds.
  debugImplementation 'com.squareup.leakcanary:leakcanary-android:3.0-alpha-1'
}
No further code is needed, now, when the library detects a memory leak, it will pop a notification and capture a heap dump to help us detect what the memory leak is and what caused it.

I strongly recommend using Leak Canary in your app.
Memory Optimization Techniques
Effective RAM optimization involves a combination of measures and strategies.
-
Avoid memory leaks with Coroutines structured concurrency. In the previous section, we explained how to detect memory leaks. Let’s not see how to avoid them. Most memory leaks are caused by background work that is no longer required but still referenced. The most effective way to prevent this is by using the Coroutines structure concurrency.
Make sure to replace all the background work mechanisms, such as Async Task, RX Kotlin, etc, with coroutines and tie the work to the adequate coroutine scope. When the work is related to a screen, tie it to its View Mode’s lifecycle by using the View Model scope. This way, the work will be canceled when the View Model is destroyed. Avoid using global scope, and if you do, make sure you cancel it when it’s no longer needed. -
Build efficient lazy loading lists with Jetpack Compose lazy column or view holder pattern. Extensive lists consume a lot of memory, especially if you load all the items at once. Currently, the most memory-efficient list mechanism is the Jetpack Compose Lazy Column; for more info, please refer to our respective article. The second most efficient way is the recycler view combined with the view holder pattern. The lazy loading technique can be extended to more objects besides lists.
-
Minimize Unused Resources: Carefully manage the resources your app consumes, particularly images and background services. Use appropriate image formats, such as WebP or PNG, and optimize image dimensions to reduce file size.
-
Optimize Animation Usage: Animations can be resource-intensive. Use animations sparingly and optimize them for efficiency to minimize memory usage.
-
Utilize Dependency Injection Frameworks: Dependency injection frameworks like Hilt or Dagger 2 can help manage and reuse objects efficiently, reducing memory usage. Those frameworks using the scope mechanism provide an easy way to allow only a single instance of an object. By allowing only a single object instance, we avoid loading the memory with unnecessary objects.
Finally, you should be Mindful of External Libraries: Carefully select and use external libraries. Some libraries may introduce unnecessary resource overhead.
By implementing these memory optimization techniques, you can ensure your Android app consistently delivers a smooth, responsive user experience while utilizing system resources efficiently.
Conclusion
In the second, we dived deep into RAM optimization. We first saw how to profile memory usage and detect memory leaks, and then we discussed optimization techniques.
Effective RAM optimization is a crucial aspect of developing high-performing Android apps. By implementing the strategies discussed in this article, you can significantly enhance your app's memory management, reducing memory leaks, improving performance, and extending battery life. Shipbook’s remote logging capabilities are also a helpful tool to track down issues.
Remember, continuous monitoring and optimization are essential for maintaining a top-notch user experience.
