Logging is the process of collecting data about events occurring in a system. It’s an indispensable tool for identifying, investigating, and debugging incidents. Every software development platform has to offer a means of logging, and iOS is no exception.
Being a UNIX-like system, iOS supported the syslog standard from as long as iOS has been around (since 2007). In addition, from 2005 Apple System Log (ASL) has been supported by all Apple operating systems. However, ASL isn’t perfect: It has multiple APIs performing similar functions to one another; it stores logs in plain text, and it requires going deep into the file system to read them. It also doesn’t perform very well, because string processing happens mostly in real time. While ASL is still available, Apple deprecated it a few years ago in favor of an improved system.
Apple’s Unified Logging
In 2016, Apple presented its replacement for ASL, the OSLog framework, also known as unified logging. And “unified” is right: It has a simple and clean API for creating entries, and an efficient way of reading logs across all Apple platforms. It logs both kernel and user events, and lets you read them all in a single place.
Beyond its impressive efficiency and visual presentation, unified logging offers performance benefits. It stores data in a binary format, thus saving a lot of space. The notorious observer effect is mitigated by deferring all string processing work until log entries are actually displayed.
Let’s dive in and put unified logging to work.
Unified Logging in Depth
Writing and Reading Logs
The easiest way to create an entry using OSLog is to initialize a Logger instance and call its log method:
    import OSLog

    let logger = Logger()
    logger.log("Hello Shipbook!")
After running this small Swift program, the message "Hello Shipbook!" will appear in the Xcode debug output:

Figure 1: Xcode debug output
Since unified logging stores its data in binary format, reading that data requires special tools. This is why Apple introduced the brand new Console application alongside the framework. This is how the log message appears in Console:

Figure 2: The Console application for reading unified logging messages
As you can see, unified logging takes care of all relevant metadata for you: Human-readable timestamps, the corresponding process name, etc.
Another often underestimated way of reading logs is by means of the OSLog framework itself. The process is straightforward: You only need to have a specific instance of the OSLogStore class and a particular point in time that you’re interested in. For example, the code snippet below will print all log entries since the app launch:
    do {
      let store = try OSLogStore(scope: .currentProcessIdentifier)
      let position = store.position(timeIntervalSinceLatestBoot: 0)

      let entries = try store.getEntries(at: position)
      // Do something with retrieved log entries.
    } catch {
      // Handle possible disk reading errors.
    }
This might be useful in testing, or for sending logs to your servers.
Log Levels
For grouping and filtering purposes, logs are usually separated into levels. The levels signify the severity of each entry. Unified logging supports five levels, with 1 being the least problematic and 5 being the most severe. Here’s the full list of supported levels and Apple’s recommendations for using them:
- The debug level is typically used for information that is useful while debugging. Log entries of this level are not stored to disk, and are displayed in Console only if enabled.
- The info level is used for non-essential information that might come in handy for debugging problems. By default, the log messages at this level are not persisted.
- The default level (also called notice level) is for logging information essential for troubleshooting potential errors. Starting from this level, messages are always persisted on disk.
- The error level is for logging process-level errors in your code.
- The fault level is intended for messages about unrecoverable errors, faults, and major bugs in your code.
Beyond their use in classifying error severity, log levels have an important impact on log processing: The higher the level, the more information the system gathers, and the higher the overhead. Debug messages produce negligible overhead, compared to the most critical (and supposedly rare) errors and faults.
Here’s how different levels can be used in code:
    logger.log(level: .debug, "I am a debug message")
    logger.log(level: .info, "I am info")
    logger.log(level: .default, "I am a notice")
    logger.log(level: .error, "I am an error")
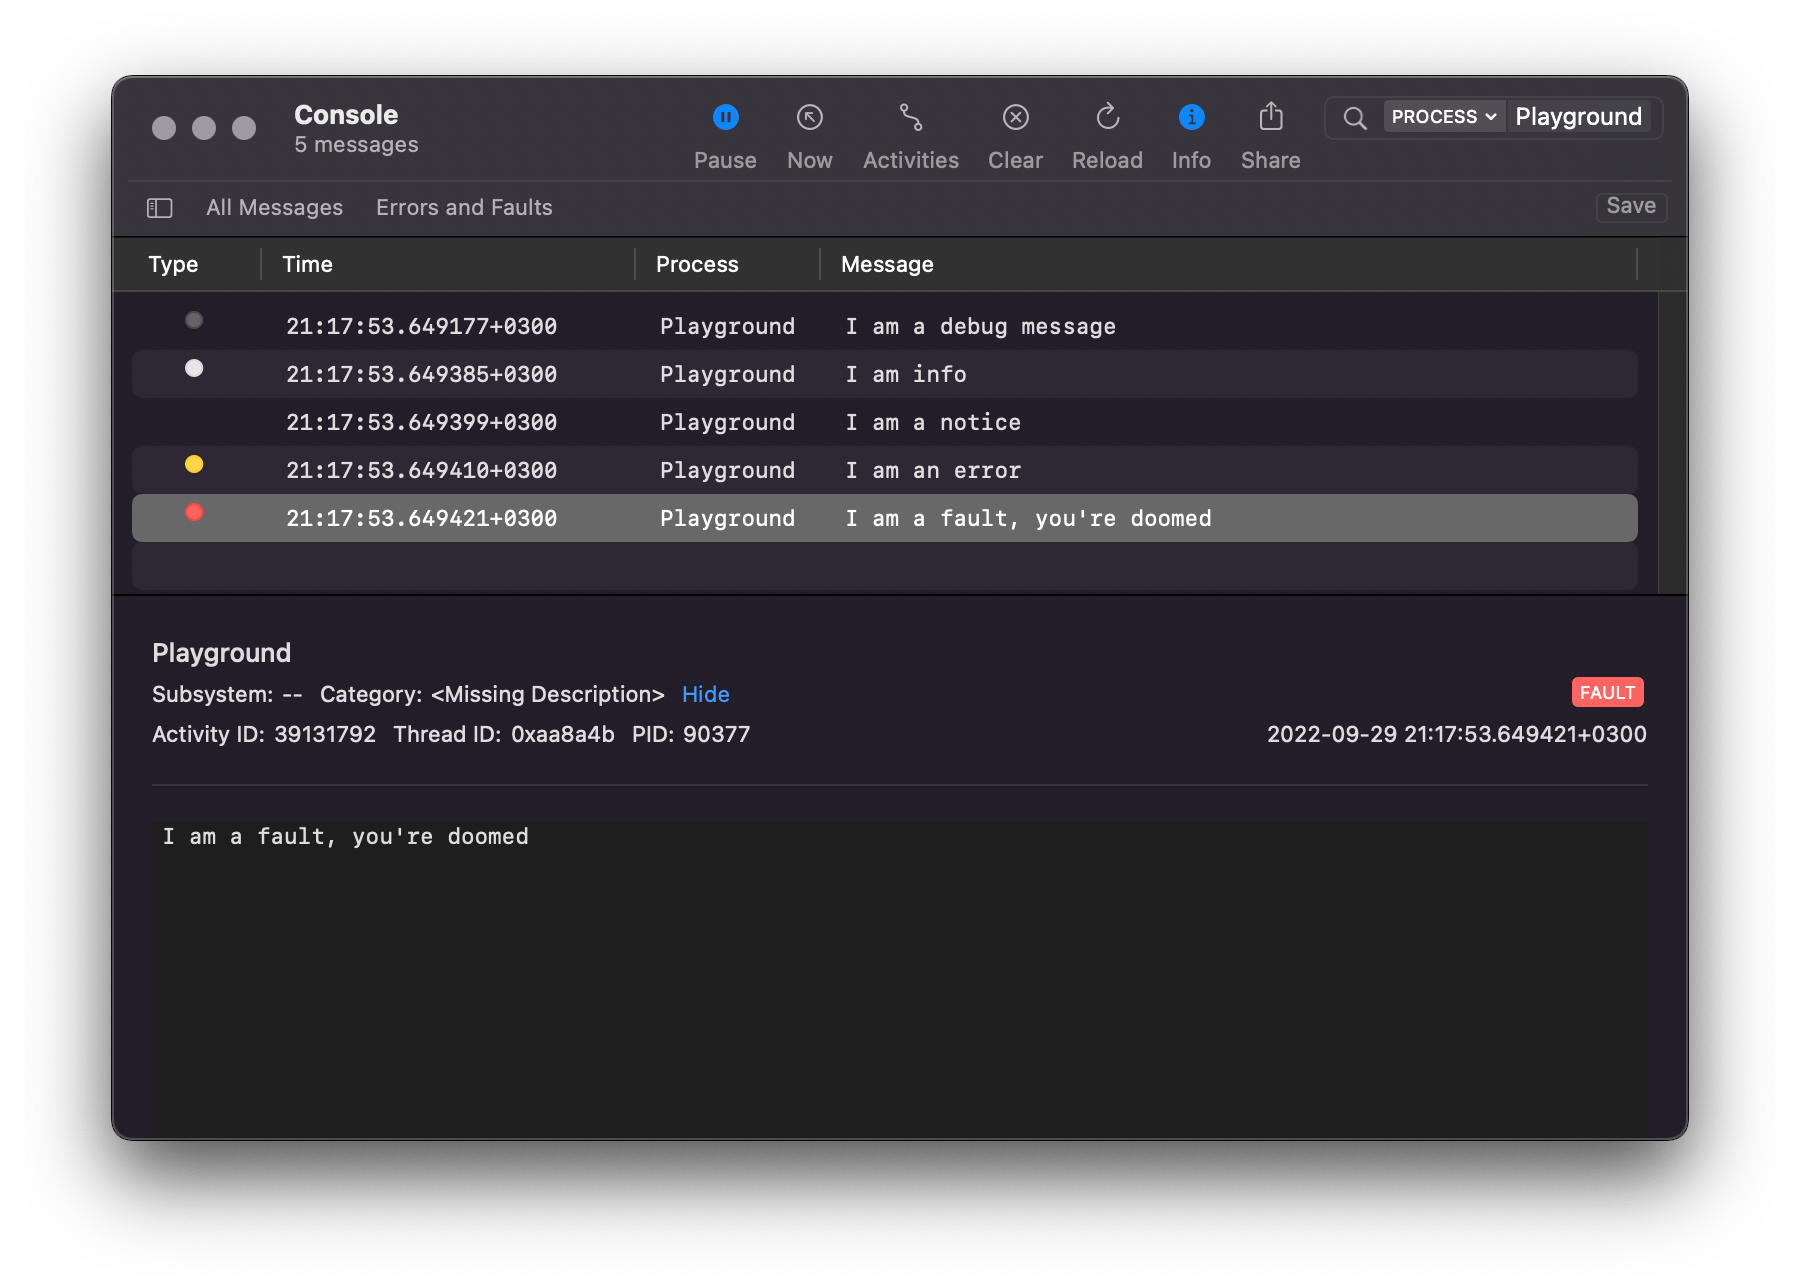
    logger.log(level: .fault, "I am a fault, you're doomed")
And this is how those entries look in Console:

Figure 3: Logs of different levels in Console
The debug and info messages are only visible here because the corresponding option is enabled. Otherwise, messages would be shown exclusively in the IDE’s debug output.
Subsystems and Categories
Logs generated by all applications are stored and processed together, along with kernel logs. This means that it’s crucial to have a way to organize log messages. Conveniently, Logger can be initialized using strings denoting the corresponding subsystem and the category of the message.
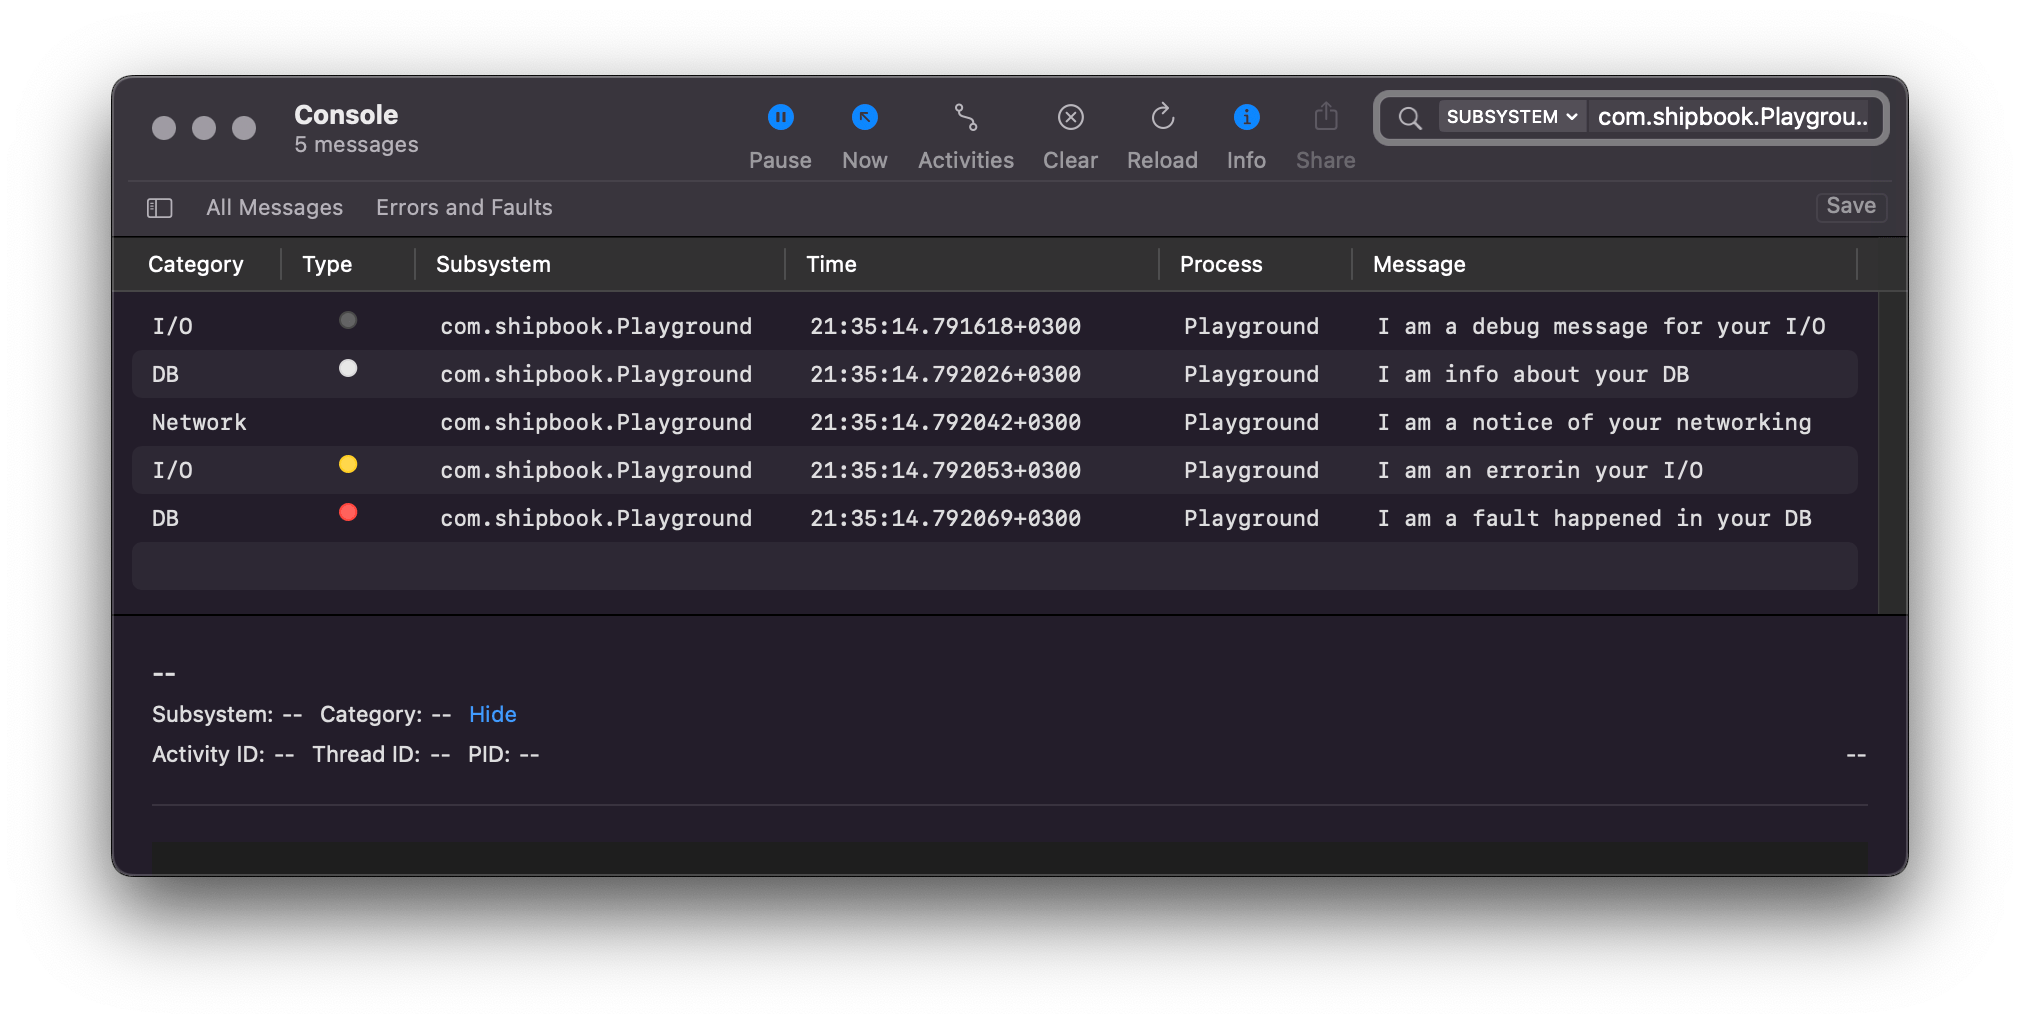
The most common way (and the method recommended by Apple) to denote the subsystem is to use the identifier of your app or its extension in reverse domain notation. The other parameter is used to categorize emitted log messages, for instance, “Network” or “I/O”. Here’s an example of a logger for categorized messages in Console:
    let logger = Logger(subsystem: "com.shipbook.Playground",
                        category: "I/O")

Figure 4: Log categorization in Console
Formatting Entries
Static strings are not the only type of data we want to use in logs. We often want to log some dynamic data together with the string, which can be achieved with string interpolation:
    logger.log(
      level: .debug,
      "User \(userID) has reached the limit of \(availableSpace)"
    )
Strictly speaking, the string literal passed as a parameter to the log method is not a String, it’s an OSLogMessage object. As I mentioned before, the logging system postpones processing the string literal until the corresponding log entry is accessed by a reading tool. The unified logging system saves all data in binary format for further use (or until it’s removed, once the storage limit is exceeded).
All common data types that can be used in an interpolated String can also be used inside an OSLogMessage: other strings, integers, arrays, etc.
Redacting Private Data
By default, almost all dynamic data—i.e., variables used inside a log message—is considered private and is hidden from the output (unless you’re running the code in Simulator or with the debugger attached). In Figure 5, below, the string value is substituted by “<private>”, but the integer is printed publicly.

Figure 5: Redacted private entry
Only scalar primitives are printed unredacted. If you need to log a dynamic value—like string or dictionary—without redacting, you can mark the interpolated variable as public:
    logger.log(
      level: .debug,
      "User \(userID, privacy: .public) has reached the limit of \(availableSpace)"
    )
Apart from public, there are also private and sensitive levels of privacy, which currently work identically to the default level. Apple recommends specifying them anyway, presumably to ensure that your code is future-proof.
In many cases, you will want to keep data private while identifying it in logs massif. This option could come in handy for filtering out all messages concerning the same user ID, for example, in which case the variable can be hidden under a mask:
    logger.log(
      level: .debug,
      "User \(userID, privacy: .private(mask: .hash)) has reached the limit of \(availableSpace)"
    )
The value in the output will be meaningless, but identifiable:

Figure 6: Private data hidden under a mask
Performance Measuring
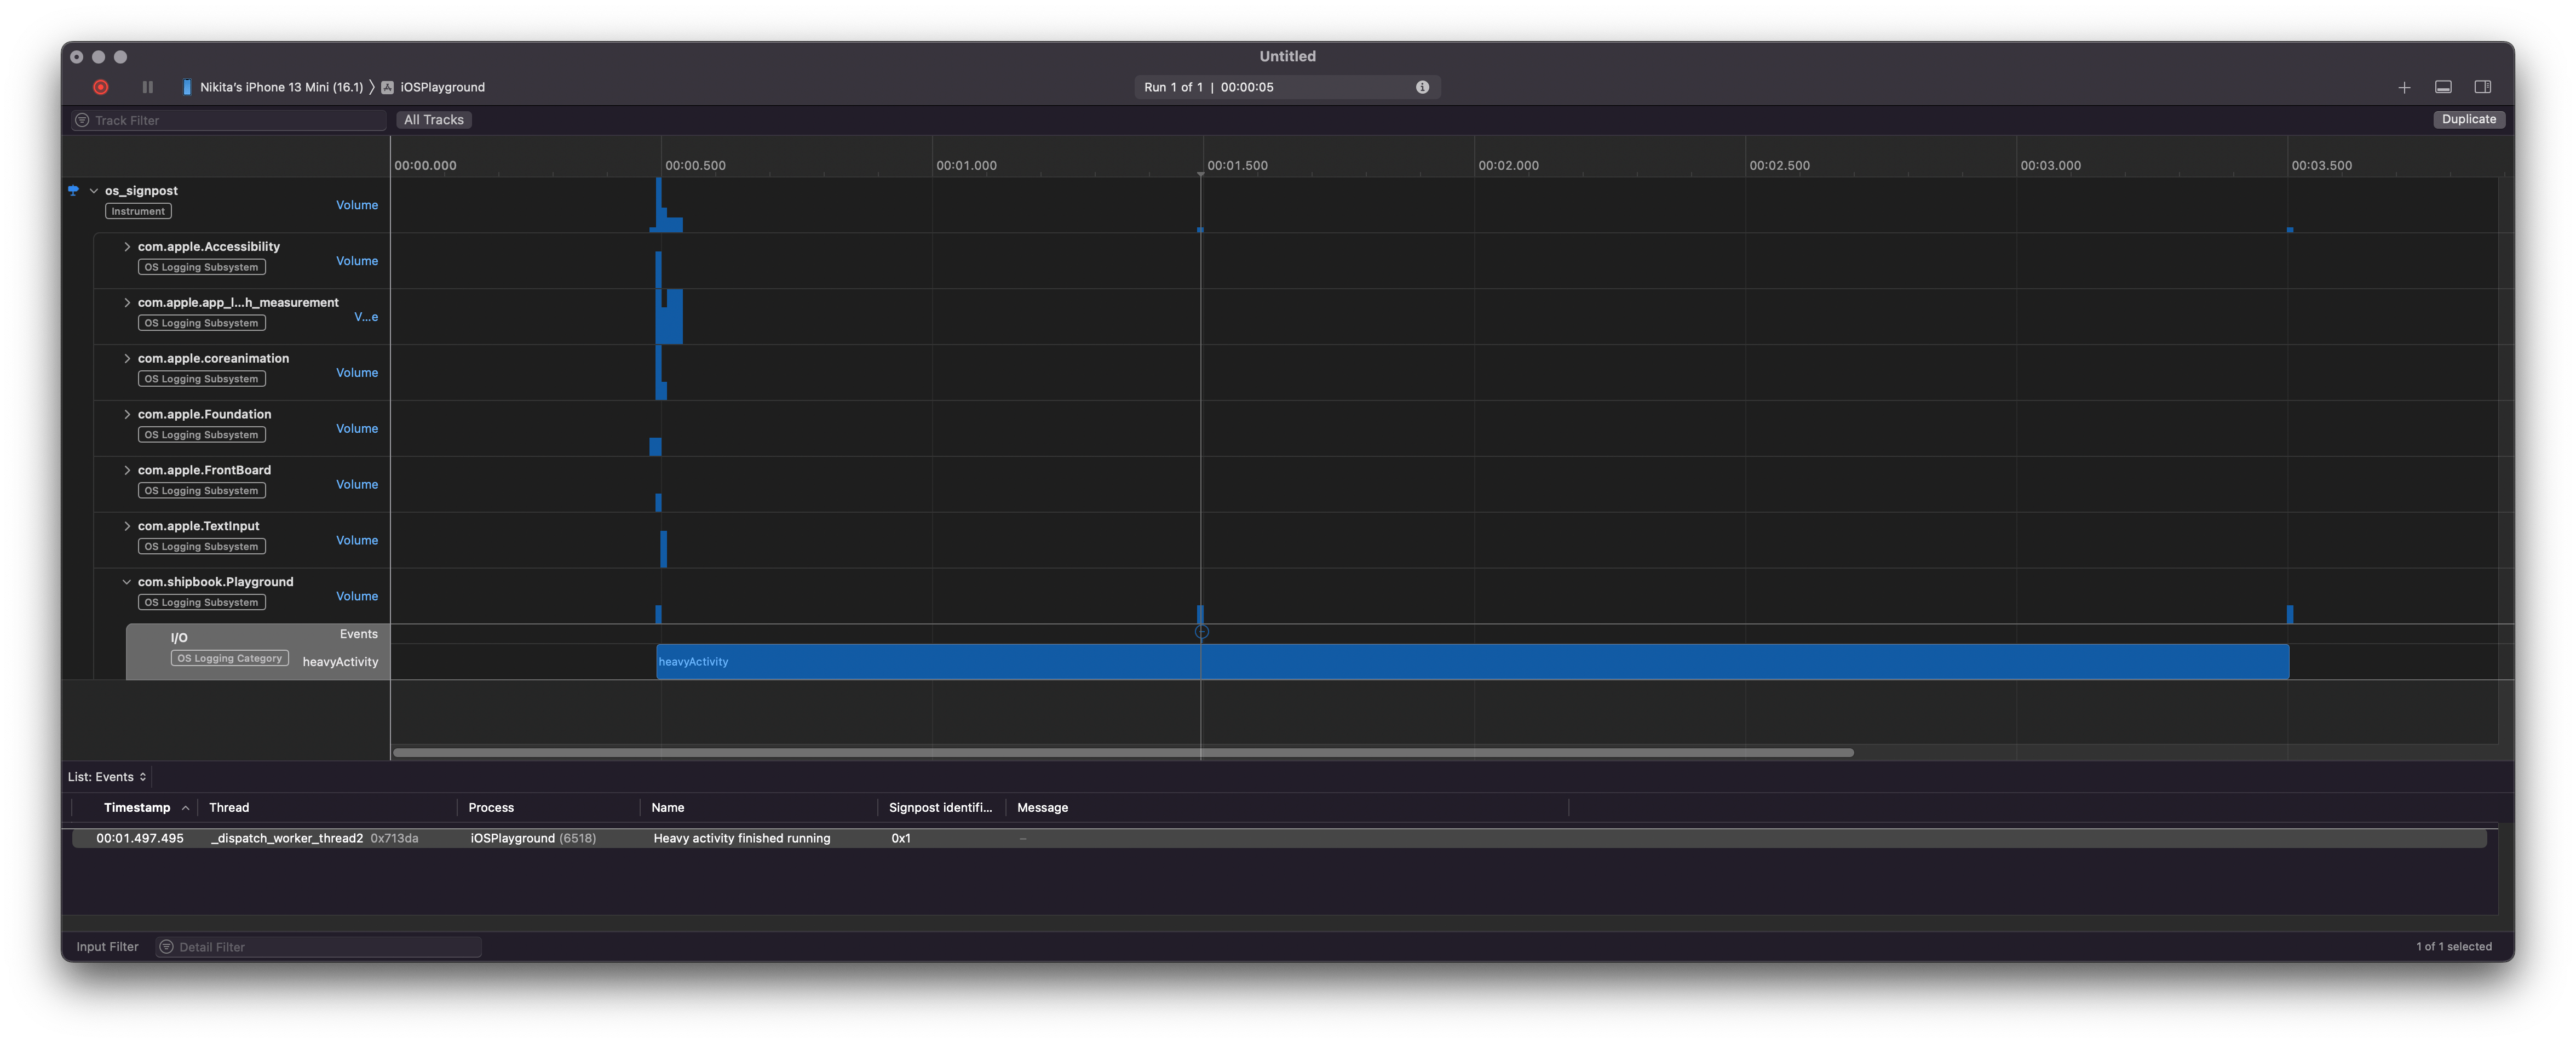
A special use case of unified logging is performance measurement, a function that was introduced two years after the system was first released. The principle is simple: You create an instance of OSSignposter and call its methods at the beginning and end of the piece of code that you want to measure. Optionally, in the middle of the measured code you can add events, which will be visible on the timeline when analyzing measured data. Here’s how it looks in assembly:
    let signposter = OSSignposter(logger: logger)
    let signpostID = signposter.makeSignpostID()

    // Start measuring.
    let state = signposter.beginInterval("heavyActivity",
                                         id: signpostID)

    // The piece of code of interest.
    runHeavyActivity()
    signposter.emitEvent("Heavy activity finished running",
                         id: signpostID)
    finalizeHeavyActivity()

    // Stop measuring.
    signposter.endInterval("heavyActivity", state)
You can analyze this data using the os_signpost tool in Instruments:

Figure 7: Performance measurement using OSSignposter
Conclusion
Apple’s unified logging is both powerful and simple to use. As its name suggests, the system can be used with all Apple platforms: iOS, iPadOS, macOS, and watchOS, using either Swift or Objective-C. Unified logging is also efficient thanks to its deferred log processing and compressed binary format storage. It mitigates the observer effect and reduces disk usage.
Gathering logs using OSLog is a great option when you’re debugging or have access to the physical device. However, when it comes to accumulating logs remotely, you need a different solution. Shipbook can take care of your needs by allowing you to gather logs remotely. Shipbook offers a simple API similar to OSLog’s, and a user-friendly interface that helps you to observe and analyze collected data.
Importantly, Shipbook integrates with Apple’s Unified Logging System, enhancing your workflow by letting you utilize the familiar tools provided by Apple when your device is connected. This integration ensures a seamless transition between remote logging and local diagnostics, making Shipbook a versatile tool for developers who require both remote data collection and the capabilities of Apple’s native logging system.
